Abercrombie & Fitch 2000 Annual Report Download - page 9
Download and view the complete annual report
Please find page 9 of the 2000 Abercrombie & Fitch annual report below. You can navigate through the pages in the report by either clicking on the pages listed below, or by using the keyword search tool below to find specific information within the annual report.-
 1
1 -
 2
2 -
 3
3 -
 4
4 -
 5
5 -
 6
6 -
 7
7 -
 8
8 -
 9
9 -
 10
10 -
 11
11 -
 12
12 -
 13
13 -
 14
14 -
 15
15
 |
 |
$11
2120
Abercrombie &Fitch
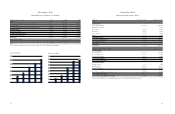
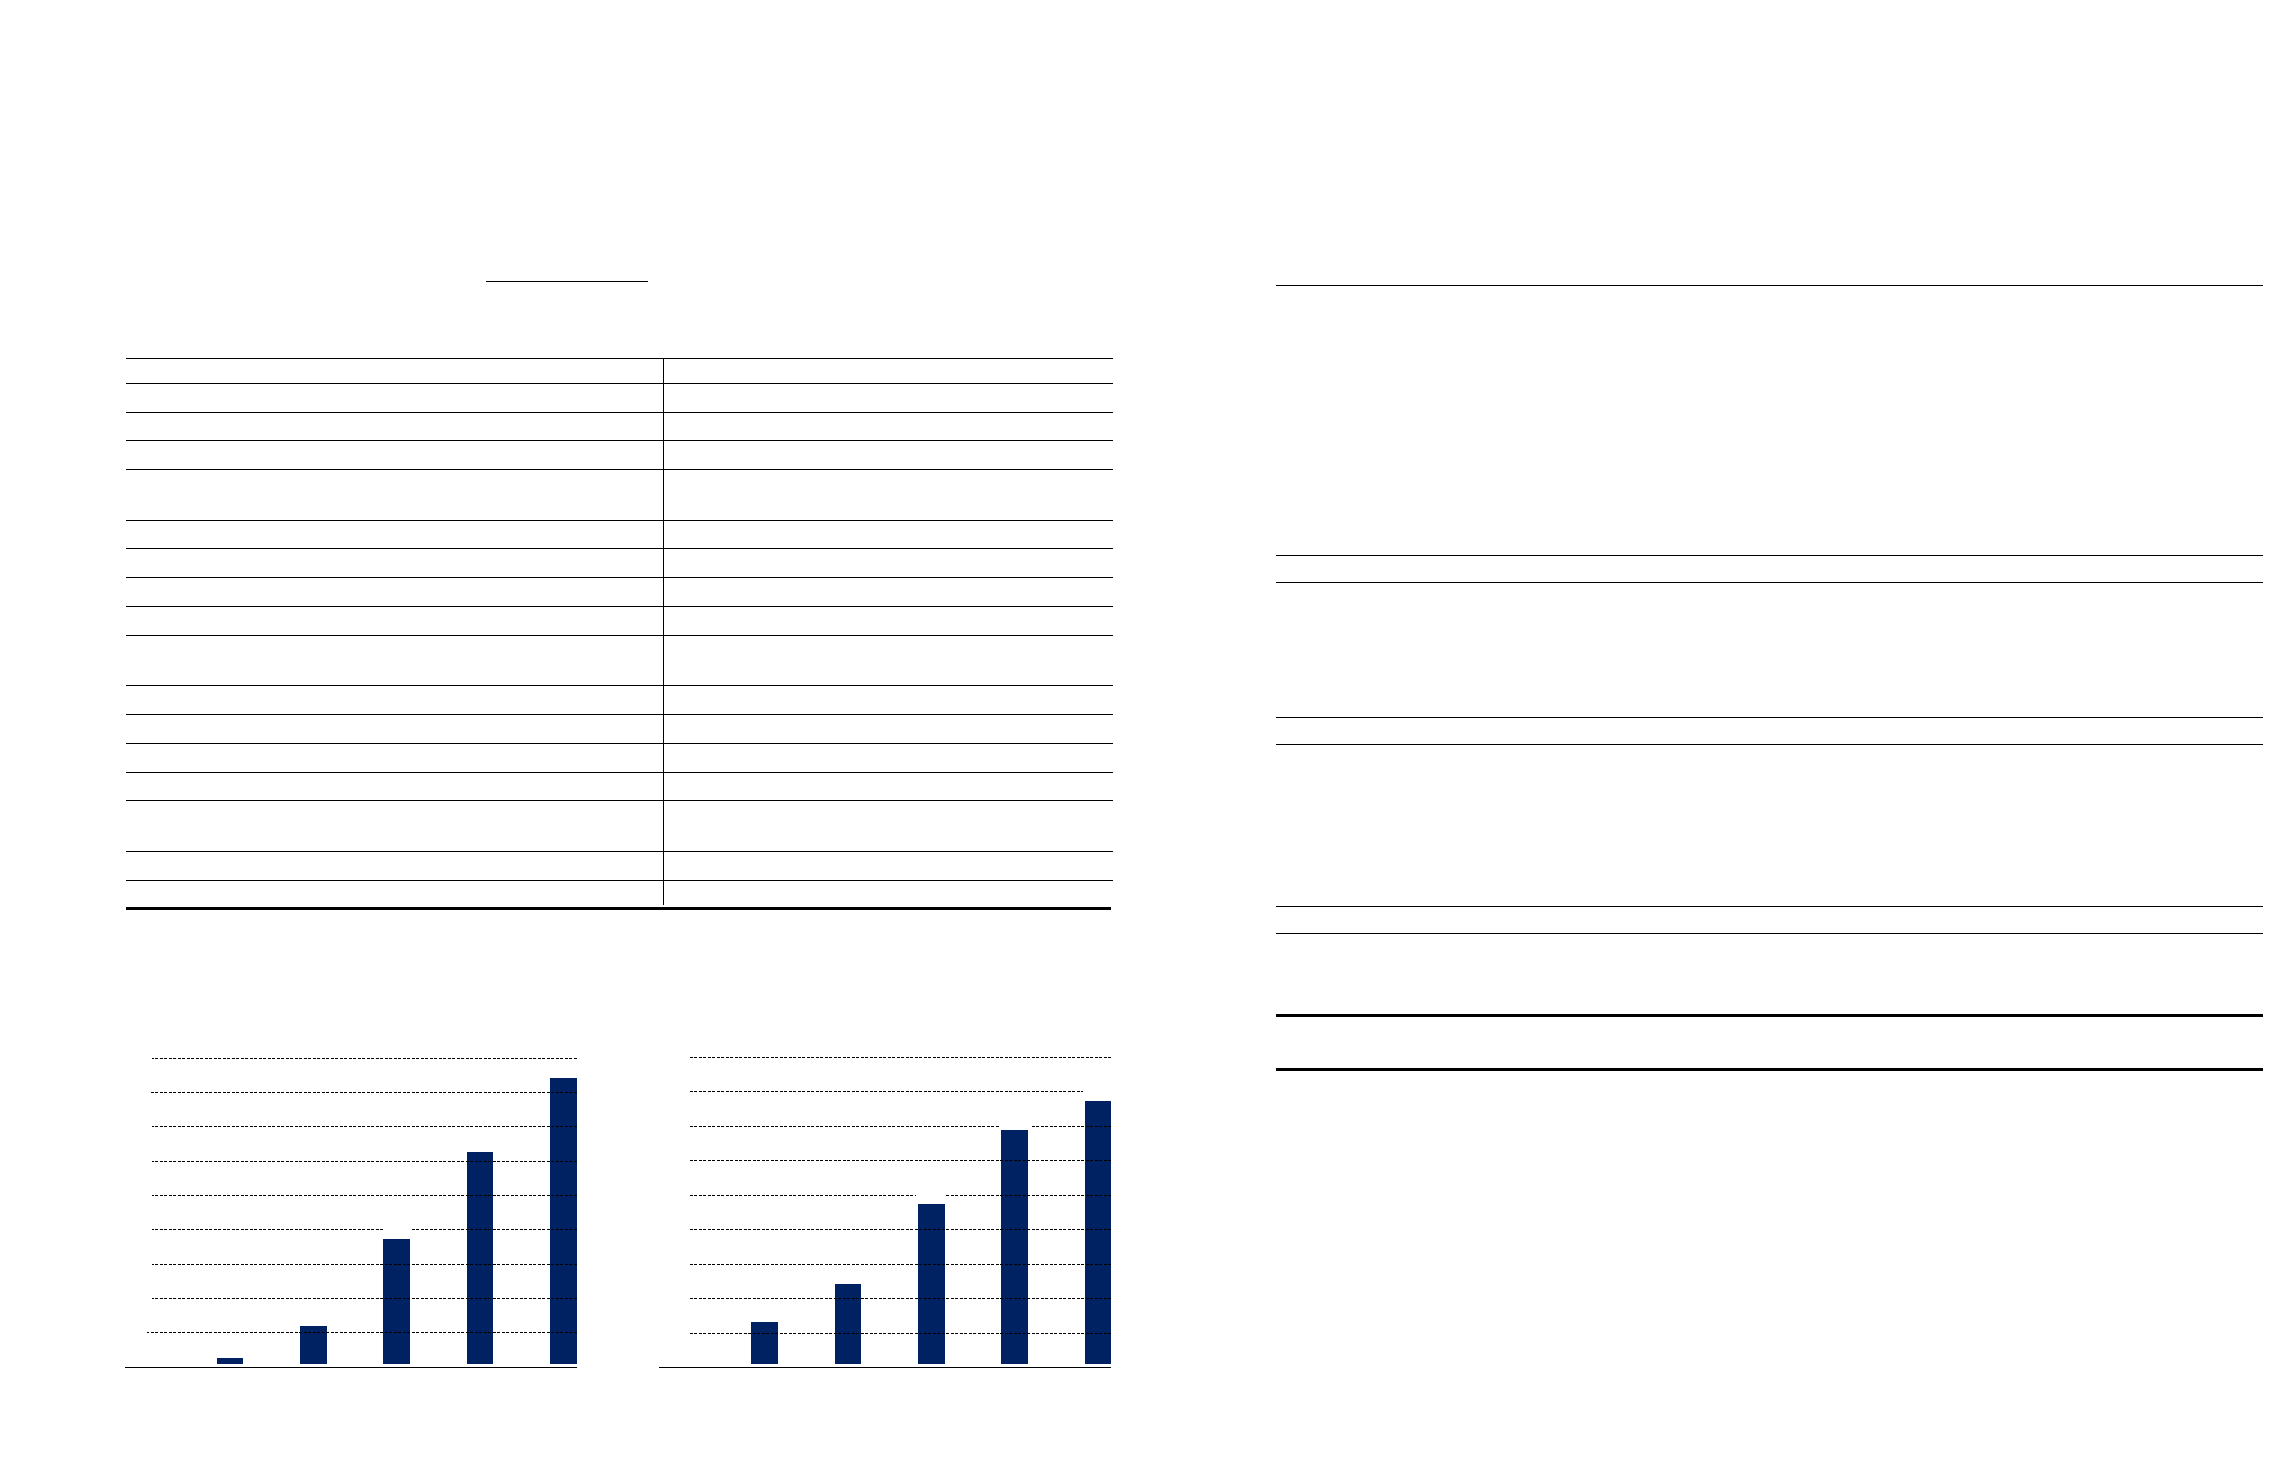
CONSOLIDATED STATEMENTS OF SHAREHOLDERS’ EQUITY
Common Stock
Treasury
Retained Stock, Total
Shares Par Paid-In Earnings at Average Shareholders’
(Thousands)Outstanding Value Capital (Deficit) Cost Equity
Balance, January 31, 1998 102,018 $1,022 $117,461 $(58,931) $ (777) $ 58,775
Purchase of Treasury Stock (490) – – – (11,240) (11,240)
Net Income – – – 102,062 – 102,062
Inssuance of Common Stock 1,200 11 25,870 – – 25,881
Tax Benefit from Exercise of Stock
Options and Vesting of Restricted Stock – – 329 – – 329
Stock Options, Restricted Stock and Other 86 – (34) – 10,332 10,298
Balance, January 30, 1999 102,814 $1,033 $143,626 $ 43,131 $ (1,685) $186,105
Purchase of Treasury Stock (1,510) – – – (50,856) (50,856)
Net Income – – – 149,604 – 149,604
Tax Benefit from Exercise of Stock
Options and Vesting of Restricted Stock – – 9,389 – – 9,389
Stock Options, Restricted Stock and Other 700 – (5,710) – 22,562 16,852
Balance, January 29, 2000 102,004 $1,033 $147,305 $192,735 $(29,979) $311,094
Purchase of Treasury Stock (3,550) – – – (43,929) (43,929)
Net Income – – – 158,133 – 158,133
Tax Benefit from Exercise of Stock
Options and Vesting of Restricted Stock – – 462 – – 462
Stock Options, Restricted Stock and Other 342 – (11,277) – 8,217 (3,060)
Balance, February 3, 2001 98,796 $1,033 $136,490 $350,868 $(65,691) $422,700
The accompanying Notes are an integral part of these Consolidated Financial Statements.
Shareholders’ Equity ($ in Millions)
1996 1997 1998 1999 2000
$59
$311
$423
$50
$100
$150
$200
$250
$300
$350
$400
$450
Earnings Per Diluted Share
1996 1997 1998 1999 2000
$0.27
$0.47
$0.20
$0.40
$0.60
$0.80
$1.00
$1.20
$1.40
$1.60
$1.80
$0.96
$1.39
$1.55
Abercrombie &Fitch
(Thousands)2000 1999 1998
Operating Activities
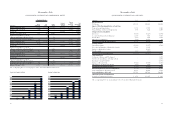
Net Income $158,133 $149,604 $102,062
Impact of Other Operating Activities on Cash Flows
Depreciation and Amortization 30,731 27,721 20,946
Noncash Charge for Deferred Compensation 4,340 5,212 11,497
Change in Assets and Liabilities
Inventories (45,735) (31,270) (10,065)
Accounts Payable and Accrued Expenses 21,626 4,999 33,137
Income Taxes (8,420) 9,258 11,087
Other Assets and Liabilities (9,486) (12,773) 355
Net Cash Provided by Operating Activities 151,189 152,751 169,019
Investing Activities
Capital Expenditures (153,481) (73,377) (37,483)
Proceeds from Maturities of Marketable Securities 45,601 11,332 –
Purchase of Marketable Securities –(56,933) –
Note Receivable (3,000) (1,500) –
Net Cash Used for Investing Activities (110,880) (120,478) (37,483)
Financing Activities
Settlement of Balance with The Limited ––23,785
Net Proceeds from Issuance of Common Stock ––25,875
Repayment of Long-Term Debt ––(50,000)
Purchase of Treasury Stock (43,929) (50,856) (11,240)
Other Changes in Shareholders’ Equity (6,707) 2,927 941
Net Cash Used for Financing Activities (50,636) (47,929) (10,639)
Net Increase/(Decrease) in Cash and Equivalents (10,327) (15,656) 120,897
Cash and Equivalents, Beginning of Year 147,908 163,564 42,667
Cash and Equivalents, End of Year $137,581 $147,908 $163,564
Significant Noncash Investing Activities
Accrual for Construction in Progress $ 9,531 $ 10,447 $ 4,393
CONSOLIDATED STATEMENTS OF CASH FLOWS
The accompanying Notes are an integral part of these Consolidated Financial Statements.
$186