Abercrombie & Fitch 2000 Annual Report Download - page 6
Download and view the complete annual report
Please find page 6 of the 2000 Abercrombie & Fitch annual report below. You can navigate through the pages in the report by either clicking on the pages listed below, or by using the keyword search tool below to find specific information within the annual report.-
 1
1 -
 2
2 -
 3
3 -
 4
4 -
 5
5 -
 6
6 -
 7
7 -
 8
8 -
 9
9 -
 10
10 -
 11
11 -
 12
12 -
 13
13 -
 14
14 -
 15
15
 |
 |

and occupancy costs, expressed as a percentage of net sales.
For the year, the gross income rate decreased to 41.2% in 2000
from 43.7% in 1999. The decrease was attributable to lower
merchandise margins, primarily due to lower IMU caused by
both a change in sales mix and the planned strategy of offering
lower opening price points in key product classifications.
In 1999, the gross income rate increased to 43.7% from 41.2%
in 1998. Merchandise margins, expressed as a percentage of
net sales, increased due to slightly higher IMU across most
merchandise categories. In addition, buying and occupancy
costs, expressed as a percentage of net sales, declined slightly
due to leverage achieved from comparable store sales increases.
The Company also improved the gross income rate through
reduced freight costs and enhanced store inventory control
procedures which reduced shrink cost.
GENERAL, ADMINISTRATIVE AND STORE OPERATING
EXPENSES General, administrative and store operating expenses,
expressed as a percentage of net sales, were 17.9% in the fourth
quarter of 2000 and 16.4% in the comparable period in 1999.
The increase in the percentage was primarily due to the inabil-
ity to leverage fixed expenses as a result of the decrease in
comparable store sales. The increase was also due to planned
one-time expenses related to the Company’s move to a new
home office and distribution center. The increases were offset
by tightly controlled headcount additions, travel expenses, store
payroll hours, outside services and compensation expense related
to management bonuses.
General, administrative and store operating expenses,
expressed as a percentage of net sales, were 16.4% in the fourth
quarter of 1999 as compared to 15.4% for the same period in
1998. The increase in the percentage was primarily due to a
change in the accounting for gift certificates and gift cards.
This was partially offset by lower compensation expenses related
to management bonuses and restricted share grants awarded to
key executives of the Company. Additionally, the Company did
not incur expenses related to service agreements with The
Limited, Inc. that expired prior to the fourth quarter of 1999
and emphasized tighter expense control in travel, relocation
and legal expenses.
General, administrative and store operating expenses for the
year, expressed as a percentage of net sales, were 20.7%, 20.2%
Net sales for the fourth quarter of 1999 increased 21% to $363.7
million from $300.1 million in 1998. The increase was primarily
due to the addition of new stores and a comparable store sales
increase of 3%. Comparable store increases were driven by men’s
pants and knits while the women’s knit business was very strong.
The Company’s catalogue, the A&F Quarterly and the Company’s
web site accounted for 3.8% of net sales in the fourth quarter of
1999 as compared to 2.2% in 1998.
Net sales for the 2000 fiscal year increased 20% to $1.24 billion
from $1.03 billion in 1999. The sales increase was attributable to
the addition of 104 stores offset by a 7% comparable store sales
decrease. The decline in comparable store sales, based on a 53 week
fiscal year for both 2000 and 1999, was across both the men’s and
women’s businesses. During the year, the assortment in each busi-
ness was repositioned to be more balanced and less focused on
graphics and included items at key opening price points. The
Company’s catalogue, the A&F Quarterly and the Company’s web
sites represented 3.8% of 2000 net sales compared to 2.9% last year.
Net sales for the 1999 fiscal year increased 28% to $1.03 billion
from $805.2 million in 1998. Sales growth resulted from a com-
parable store sales increase of 10% and the addition of 54 new
stores. Comparable store sales increases were driven by both men’s
and women’s knits and pants. Net retail sales per gross square foot
for the Company increased 6%, principally from an increase in the
number of transactions per store. The Company’s catalogue, the
A&F Quarterly and the Company’s web site represented 2.9% of
1999 net sales compared to 2.0% of 1998 net sales.
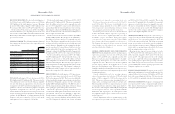
GROSS INCOME For the fourth quarter of 2000, gross income,
expressed as a percentage of net sales, decreased to 46.2% from
50.9% for the same period in 1999. The decrease was attributable
to lower merchandise margins (representing gross income before
the deduction of buying and occupancy costs) due to lower initial
markups (IMU) and higher markdowns. The IMU was affected
by both a change in sales mix and the planned strategy of offering
lower opening price points in key product classifications.
Gross income, expressed as a percentage of net sales, increased
to 50.9% for the fourth quarter of 1999 from 48.3% for the same
period in 1998. The increase was attributable to higher mer-
chandise margins, resulting from higher IMU, and improved
control of store inventory shrinkage and merchandise freight
costs. The Company also achieved some leverage in buying
RESULTS OF OPERATIONS Net sales for the fourth quarter of
the 2000 fiscal year were $439.4 million, an increase of 21% from
$363.7 million for the fourth quarter a year ago. Operating
income was $124.1 million compared to $125.3 million last year.
Net income per diluted share was $.76, up 4% from $.73 last year.
Net sales for the 2000 fiscal year increased 20% to $1.24 billion
from $1.03 billion last year. Operating income for the year
increased 5% to $253.7 million from $242.1 million in 1999.
Net income per diluted share was $1.55 compared to $1.39 a year
ago, an increase of 12%.
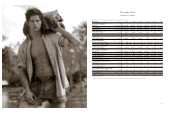
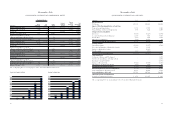
FINANCIAL SUMMARY The following summarized financial
data compares the 2000 fiscal year to the comparable periods
for 1999 and 1998:
% Change
2000- 1999-
2000 1999 1998 1999 1998
Net sales (millions) $1,237.6 $1,030.9 $805.2 20% 28%
Increase (decrease) in comparable
store sales (7%) 10% 35%
Retail sales increase attributable
to new and remodeled stores,
magazine, catalogue and web site 27% 18% 22%
Retail sales per average
gross square foot $0,474 $0,505 $0,476 (6%) 6%
Retail sales per average store
(thousands) $3,944 $4,487 $4,484 (12%) –
Average store size at year-end
(gross square feet) 8,047 8,695 9,140 (7%) (5%)
Gross square feet at year-end
(thousands) 2,849 2,174 1,791 31% 21%
Number of stores:
Beginning of year 250 196 156
Opened 104 54 41
Closed (–)– (1)
End of year 354 250 196
NET SALES Fourth quarter 2000 net sales increased 21% to
$439.4 million from $363.7 million in 1999. The increase was due
to the addition of new stores offset by a 9% decline in comparable
store sales. The decline in comparable store sales, based on a 14
week quarter for both 2000 and 1999, was primarily due to com-
parable store sales decreases in the men’s graphic tees and pants
departments. Comparable store sales were positive in the
women’s business for the quarter based on strong increases in the
sweaters, denim and outerwear departments. The Company’s
catalogue, the A&F Quarterly (a catalogue/magazine) and the
Company’s web sites accounted for 5.0% of net sales in the
fourth quarter of 2000 as compared to 3.8% in 1999.
15
Abercrombie &Fitch
14
MANAGEMENT’S DISCUSSION AND ANALYSIS
Abercrombie &Fitch
and 20.4% in 2000, 1999 and 1998, respectively. The rate has
increased in 2000 primarily due to the inability to leverage fixed
expenses as a result of the decrease in comparable store sales.
The increase was partially offset by the Company’s continued
focus on discretionary expense controls. The 1999 improvement
was due to the control of expenses and favorable leveraging of
expenses due to higher comparable store sales.
OPERATING INCOME Operating income, expressed as a per-
centage of net sales, was 28.2% and 20.5% for the fourth quarter
and fiscal year of 2000, respectively, compared to 34.5% and
23.5% for the same periods in 1999. The decline in operating
income as a percentage of sales in these periods is primarily a
result of lower gross income percentages. Higher general, admin-
istrative and store operating expenses also added to the decrease
in the operating income percentage of net sales.
Operating income, expressed as a percentage of net sales,
was 34.5% and 23.5% for the fourth quarter and fiscal year of
1999, respectively, compared to 32.9% and 20.7% for the same
periods in 1998. The improvement was the result of higher
gross income coupled with lower general, administrative and
store operating expenses, expressed as a percentage of net sales.
Sales volume and gross income increased at a faster rate than
general, administrative and store operating expenses due to the
Company’s emphasis on cost controls.
INTEREST INCOME/EXPENSE Net interest income was $2.5
million in the fourth quarter of 2000 and $7.8 million for all of 2000
compared with net interest income of $2.5 million and $7.3 mil-
lion for the corresponding periods last year. Net interest income
in 2000 and 1999 was primarily from short-term investments.
FINANCIAL CONDITION The Company’s continuing growth
in net income provides evidence of financial strength and flexi-
bility. A more detailed discussion of liquidity, capital resources
and capital requirements follows.