Abercrombie & Fitch 1999 Annual Report Download - page 9
Download and view the complete annual report
Please find page 9 of the 1999 Abercrombie & Fitch annual report below. You can navigate through the pages in the report by either clicking on the pages listed below, or by using the keyword search tool below to find specific information within the annual report.-
 1
1 -
 2
2 -
 3
3 -
 4
4 -
 5
5 -
 6
6 -
 7
7 -
 8
8 -
 9
9 -
 10
10 -
 11
11 -
 12
12 -
 13
13 -
 14
14 -
 15
15 -
 16
16 -
 17
17 -
 18
18 -
 19
19 -
 20
20 -
21
 |
 |

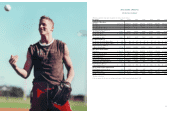
13
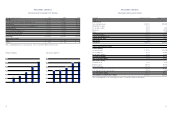
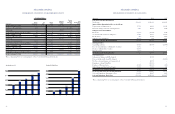
(Thousands except per share and per square foot amounts, ratios and store and associate data)
Fiscal Year 1999 1998 1997 1996 1995* 1994 1993
Summary of Operations
Net Sales $1,042,056 $815,804 $521,617 $335,372 $235,659 $165,463 $110,952
Gross Income $ 465,583 $343,951 $201,080 $123,766 $079,794 $056,820 $030,562
Operating Income (Loss) $ 242,064 $166,958 $084,125 $045,993 $023,798 $013,751 $0(4,064)
Operating Income (Loss) as a
Percentage of Sales 23.2% 20.5% 16.1% 13.7% 10.1% 8.3% (3.7%)
Net Income (Loss) $ 149,604 $102,062 $048,322 $024,674 $014,298 $008,251 $ (2,464)
Net Income (Loss) as a
Percentage of Sales 14.4% 12.5% 9.3% 7.4% 6.1% 5.0% (2.2%)
Per Share Results (1)
Net Income (Loss) Per Basic Share $ 1.45 $0000.99 $0000.47 $0000.27 $0000.17 $000 .10 $000(.03)
Net Income (Loss) Per Diluted Share $ 1.39 $0000.96 $0000.47 $0000.27 $0000.17 $000 .10 $000(.03)
Weighted Average Diluted
Shares Outstanding 107,641 0106,202 $102,956 0091,520 0$86,000 $086,000 $086,000
Other Financial Information
Total Assets $ 458,166 $319,161 $183,238 $105,761 $ 87,693 $ 58,018 $ 48,882
Return on Average Assets 38% 41% 33% 26% 20% 15% (4%)
Capital Expenditures $ 83,824 $041,876 $029,486 $ 24,323 $ 24,526 $ 12,603 $ 4,694
Long-Term Debt ––$050,000 $ 50,000 – – –
Shareholders’ Equity (Deficit) $ 311,094 $186,105 $058,775 $ 11,238 $(22,622) $(37,070) $(45,341)
Comparable Store Sales Increase 10% 35% 21% 13% 5% 15% 6%
Retail Sales Per Average
Gross Square Foot $ 512 $000,483 $000,376 $ 306 $ 290 $ 284 $ 243
Stores and Associates at End of Year
Total Number of Stores Open 250 196 156 127 100 67 49
Gross Square Feet 2,174,000 1,791,000 1,522,000 1,229,000 962,000 665,000 499,000
Number of Associates 11,300 9,500 006,700 4,900 3,000 2,300 1,300
*Fifty-three week fiscal year.
(1) Per share amounts reflect the two-for-one stock split on the Company’s Class A Common Stock, paid on June 15, 1999.
FINANCIAL SUMMARY
Abercrombie &Fitch Co.