Abercrombie & Fitch 1999 Annual Report Download - page 12
Download and view the complete annual report
Please find page 12 of the 1999 Abercrombie & Fitch annual report below. You can navigate through the pages in the report by either clicking on the pages listed below, or by using the keyword search tool below to find specific information within the annual report.-
 1
1 -
 2
2 -
 3
3 -
 4
4 -
 5
5 -
 6
6 -
 7
7 -
 8
8 -
 9
9 -
 10
10 -
 11
11 -
 12
12 -
 13
13 -
 14
14 -
 15
15 -
 16
16 -
 17
17 -
 18
18 -
 19
19 -
 20
20 -
 21
21
 |
 |
2322
Abercrombie &Fitch Co.
Abercrombie &Fitch Co.
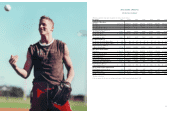
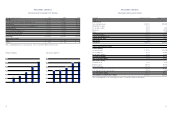
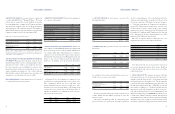
CONSOLIDATED STATEMENTS OF INCOME
1999 1998 1997
$1,042,056 $815,804 $521,617
576,473 471,853 320,537
465,583 343,951 201,080
223,519 176,993 116,955
242,064 166,958 84,125
(7,270) (3,144) 3,583
249,334 170,102 80,542
99,730 68,040 32,220
$ 149,604 $102,062 $ 48,322
$ 1.45 $ .99 $ .47
$ 1.39 $ .96 $ .47
(Thousands except per share amounts)
Net Sales
Cost of Goods Sold, Occupancy and Buying Costs
Gross Income
General, Administrative and Store Operating Expenses
Operating Income
Interest (Income)/ Expense, Net
Income Before Income Taxes
Provision for Income Taxes
Net Income
Net Income Per Share:
Basic
Diluted
The accompanying Notes are an integral part of these Consolidated Financial Statements.
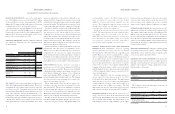
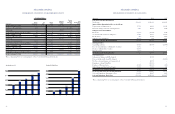
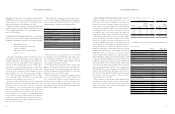
(Thousands) January 29, 2000 January 30, 1999
Assets
Current Assets
Cash and Equivalents $147,908 $163,564
Marketable Securities 45,601 –
Accounts Receivable 11,447 4,101
Inventories 75,262 43,992
Other 19,999 6,578
Total Current Assets 300,217 218,235
Property and Equipment, Net 146,403 89,558
Deferred Income Taxes 11,060 10,854
Other Assets 486 631
Total Assets $458,166 $319,278
Liabilities and Shareholders’ Equity
Current Liabilities
Accounts Payable $018,714 $024,759
Accrued Expenses 85,373 63,882
Income Taxes Payable 33,779 33,704
Total Current Liabilities 137,866 122,345
Other Long-Term Liabilities 9,206 10,828
Shareholders’ Equity
Common Stock 1,033 1,033
Paid-In Capital 147,305 143,626
Retained Earnings (Deficit) 192,735 43,131
341,073 187,790
Less: Treasury Stock, at Average Cost (29,979) (1,685)
Total Shareholders’ Equity 311,094 186,105
Total Liabilities and Shareholders’ Equity $458,166 $319,278
The accompanying Notes are an integral part of these Consolidated Financial Statements.
CONSOLIDATED BALANCE SHEETS
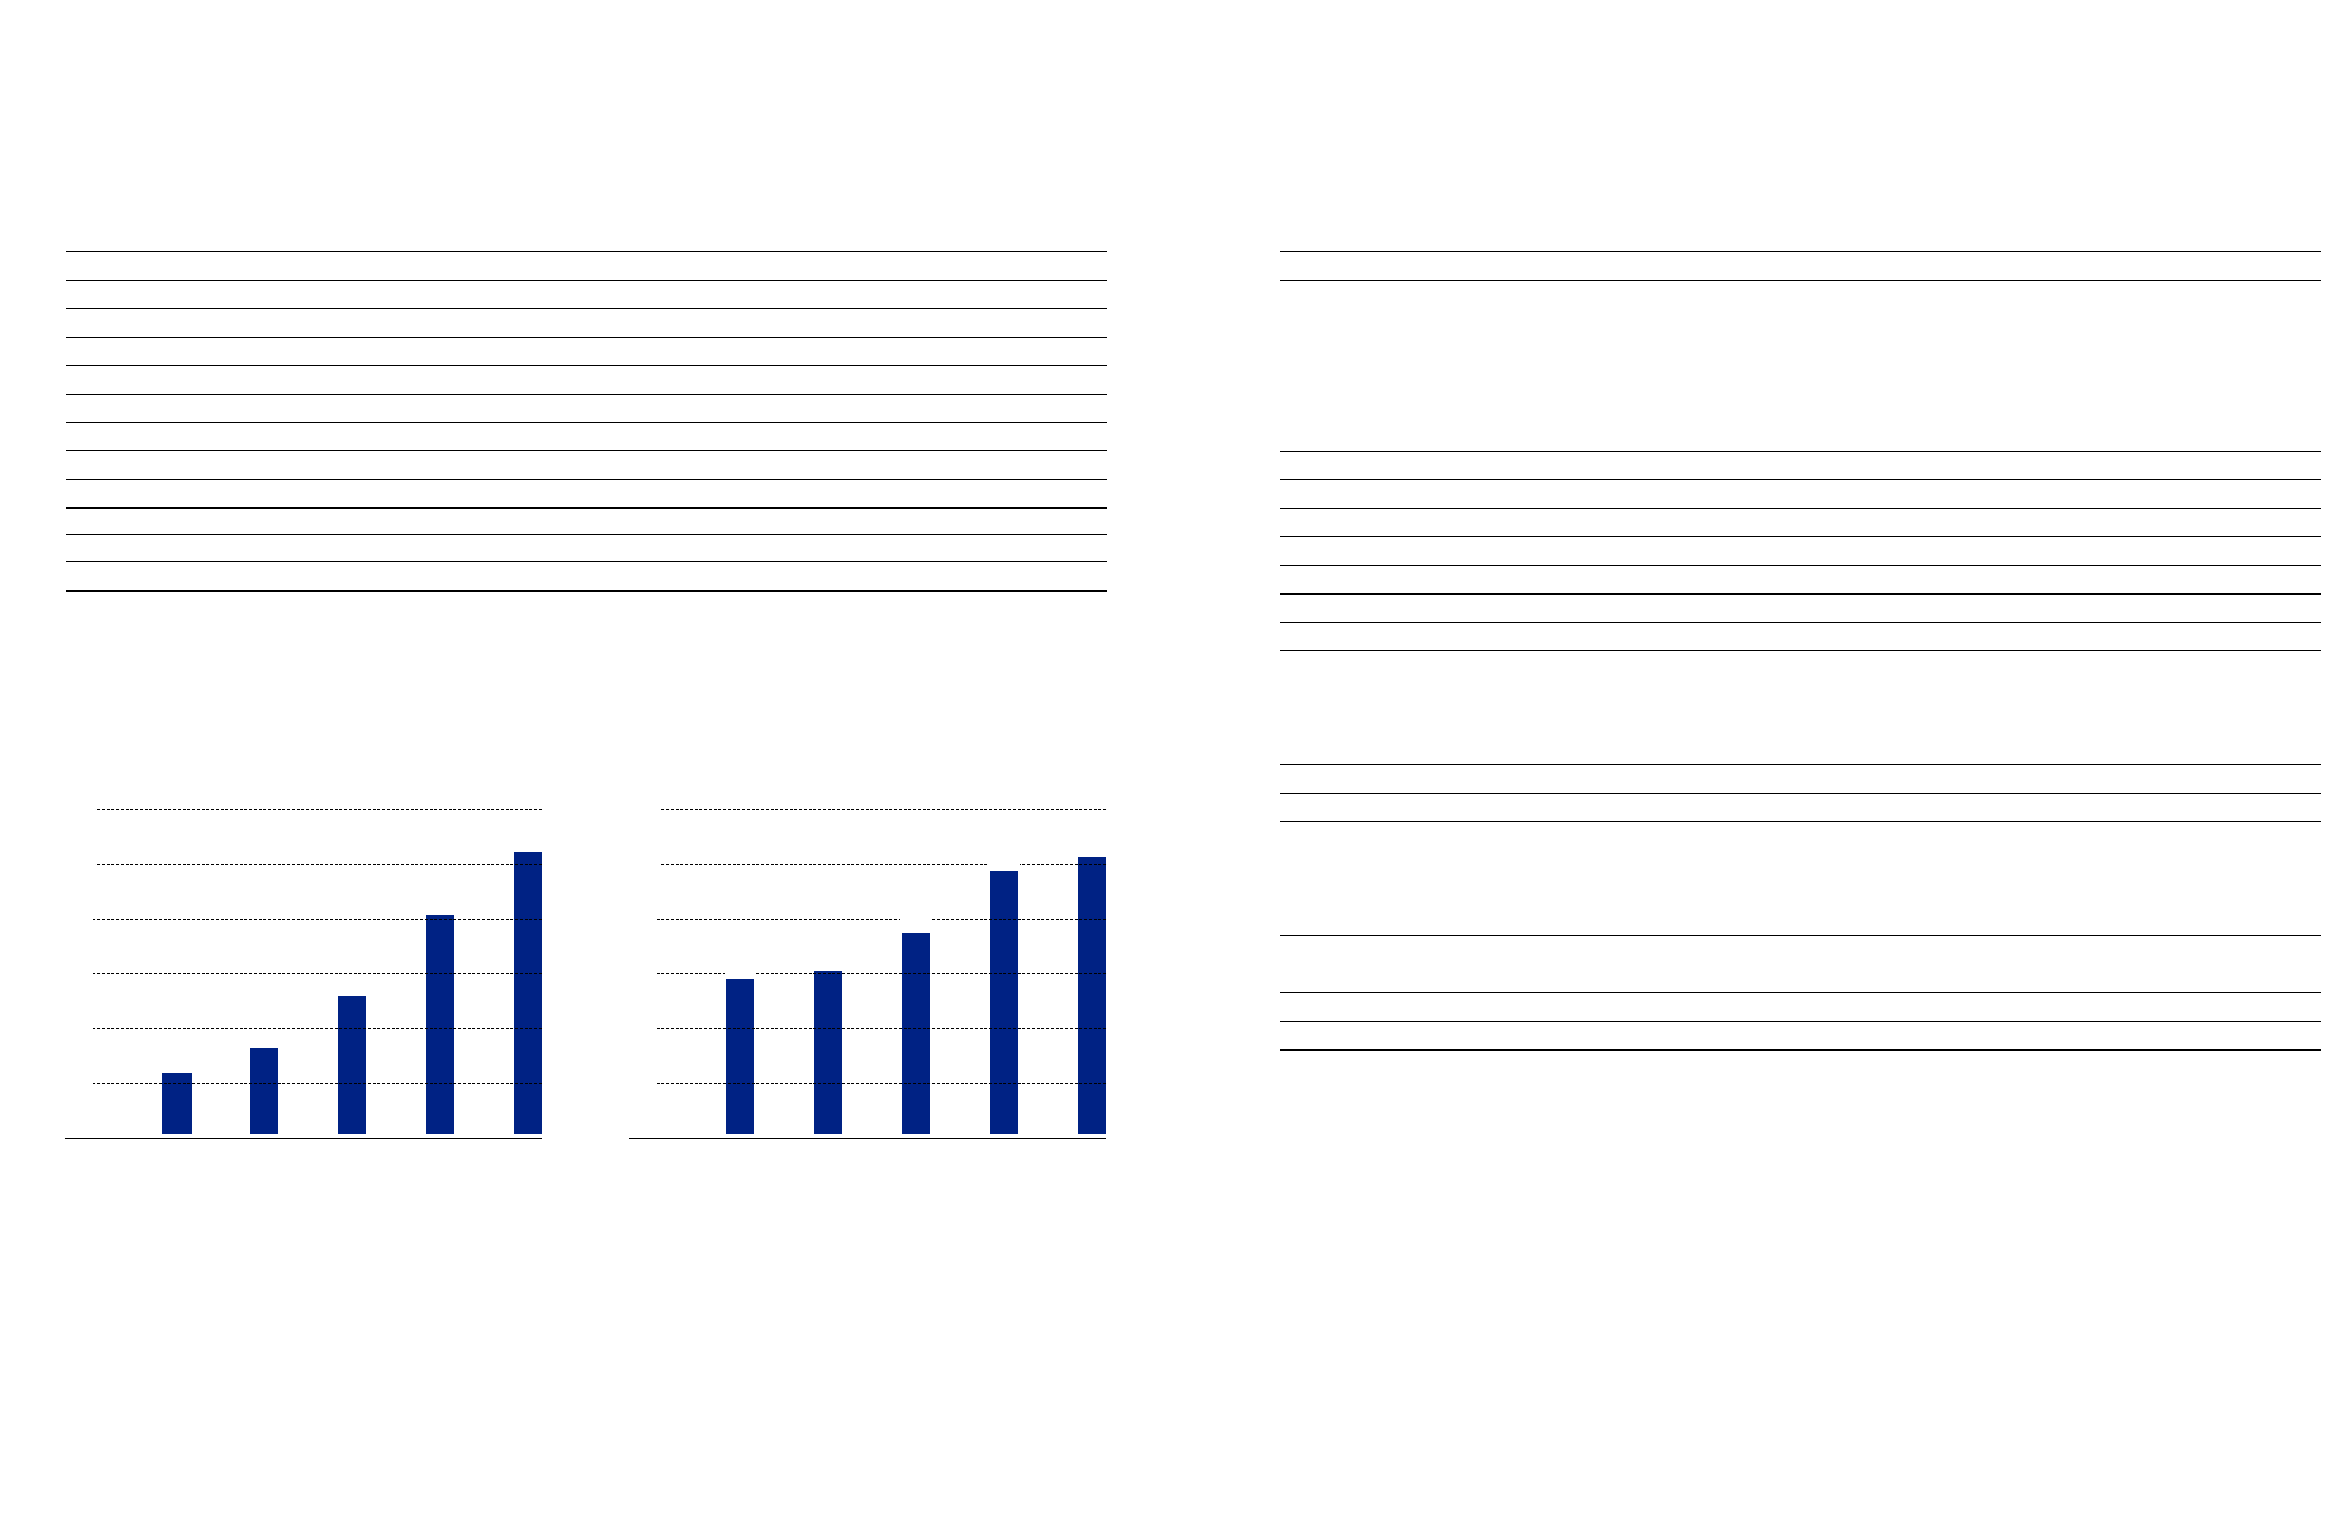
Net Sales ($ in Millions)
95 96 97 98 99
$1200
$1000
$800
$600
$400
$200
$236
$335
$522
$816
$1,042
Sales per Gross Square Foot
95 96 97 98 99
$600
$500
$400
$300
$200
$100
$290 $306
$376
$483
$512