Abercrombie & Fitch 1999 Annual Report Download - page 13
Download and view the complete annual report
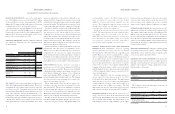
Please find page 13 of the 1999 Abercrombie & Fitch annual report below. You can navigate through the pages in the report by either clicking on the pages listed below, or by using the keyword search tool below to find specific information within the annual report.-
 1
1 -
2
-
 3
3 -
 4
4 -
 5
5 -
 6
6 -
 7
7 -
 8
8 -
 9
9 -
 10
10 -
 11
11 -
 12
12 -
 13
13 -
 14
14 -
 15
15 -
 16
16 -
 17
17 -
 18
18 -
 19
19 -
 20
20 -
 21
21
 |
 |
2120
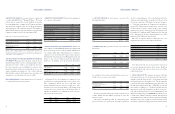
Abercrombie &Fitch Co. Abercrombie &Fitch Co.
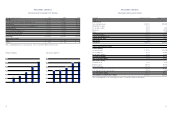
(Thousands)1999 1998 1997
Cash Flows from Operating Activities
Net Income $149,604 $102,062 $ 48,322
Impact of Other Operating Activities on Cash Flows
Depreciation and Amortization 27,721 20,946 16,342
Non Cash Charge for Deferred Compensation 5,212 11,497 6,219
Change in Assets and Liabilities
Inventories (31,270) (10,065) 1,016
Accounts Payable and Accrued Expenses 15,446 37,530 22,309
Income Taxes (131) 10,758 4,606
Other Assets and Liabilities (12,773) 355 1,381
Net Cash Provided by Operating Activities 153,809 173,083 100,195
Investing Activities
Capital Expenditures (83,824) (41,876) (29,486)
Proceeds from Maturities of Marketable Securities 11,332 ––
Purchase of Marketable Securities (56,933) ––
Note Receivable (1,500) ––
Net Cash Used for Investing Activities (130,925) (41,876) (29,486)
Financing Activities
Settlement of Balance with The Limited –23,785 –
Decrease in Receivable from The Limited –– (29,202)
Net Proceeds from Issuance of Common Stock –25,875 –
Repayment of Long-Term Debt –(50,000) –
Purchase of Treasury Stock (50,856) (11,240) (929)
Other Changes in Shareholders’ Equity 12,316 1,270 144
Net Cash Used for Financing Activities (38,540) (10,310) (29,987)
Net Increase/(Decrease) in Cash and Equivalents (15,656) 120,897 40,722
Cash and Equivalents, Beginning of Year 163,564 42,667 1,945
Cash and Equivalents, End of Year $147,908 $163,564 $ 42,667
CONSOLIDATED STATEMENTS OF CASH FLOWS
The accompanying Notes are an integral part of these Consolidated Financial Statements.
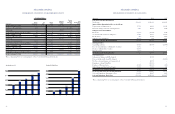
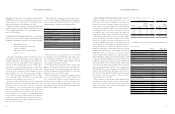
CONSOLIDATED STATEMENTS OF SHAREHOLDERS’ EQUITY
Common Stock
Treasury
Retained Stock, Total
Shares Par Paid-In Earnings at Average Shareholders’
(Thousands)Outstanding Value Capital (Deficit) Cost Equity
Balance, February 1, 1997 102,100 $1,022 $117,469 $(107,253) – $ 11,238
Purchase of Treasury Stock (100) – – – $ (929) (929)
Net Income – – – 48,322 – 48,322
Stock Options, Restricted Stock and Other 18 – (8) – 152 144
Balance, January 31, 1998 102,018 $1,022 $117,461 $ (58,931) $ (777) $ 58,775
Purchase of Treasury Stock (490) – – – (11,240) (11,240)
Net Income – – – 102,062 – 102,062
Issuance of Common Stock 1,200 11 25,870 – – 25,881
Stock Options, Restricted Stock and Other 86 – 295 – 10,332 10,627
Balance, January 30, 1999 102,814 $1,033 $143,626 $ 43,131 $ (1,685) $ 186,105
Purchase of Treasury Stock (1,510) – – – (50,856) (50,856)
Net Income – – – 149,604 – 149,604
Stock Options, Restricted Stock and Other 700 – 3,679 – 22,562 26,241
Balance, January 29, 2000 102,004 $1,033 $147,305 $ 192,735 $(29,979) $ 311,094
The accompanying Notes are an integral part of these Consolidated Financial Statements.
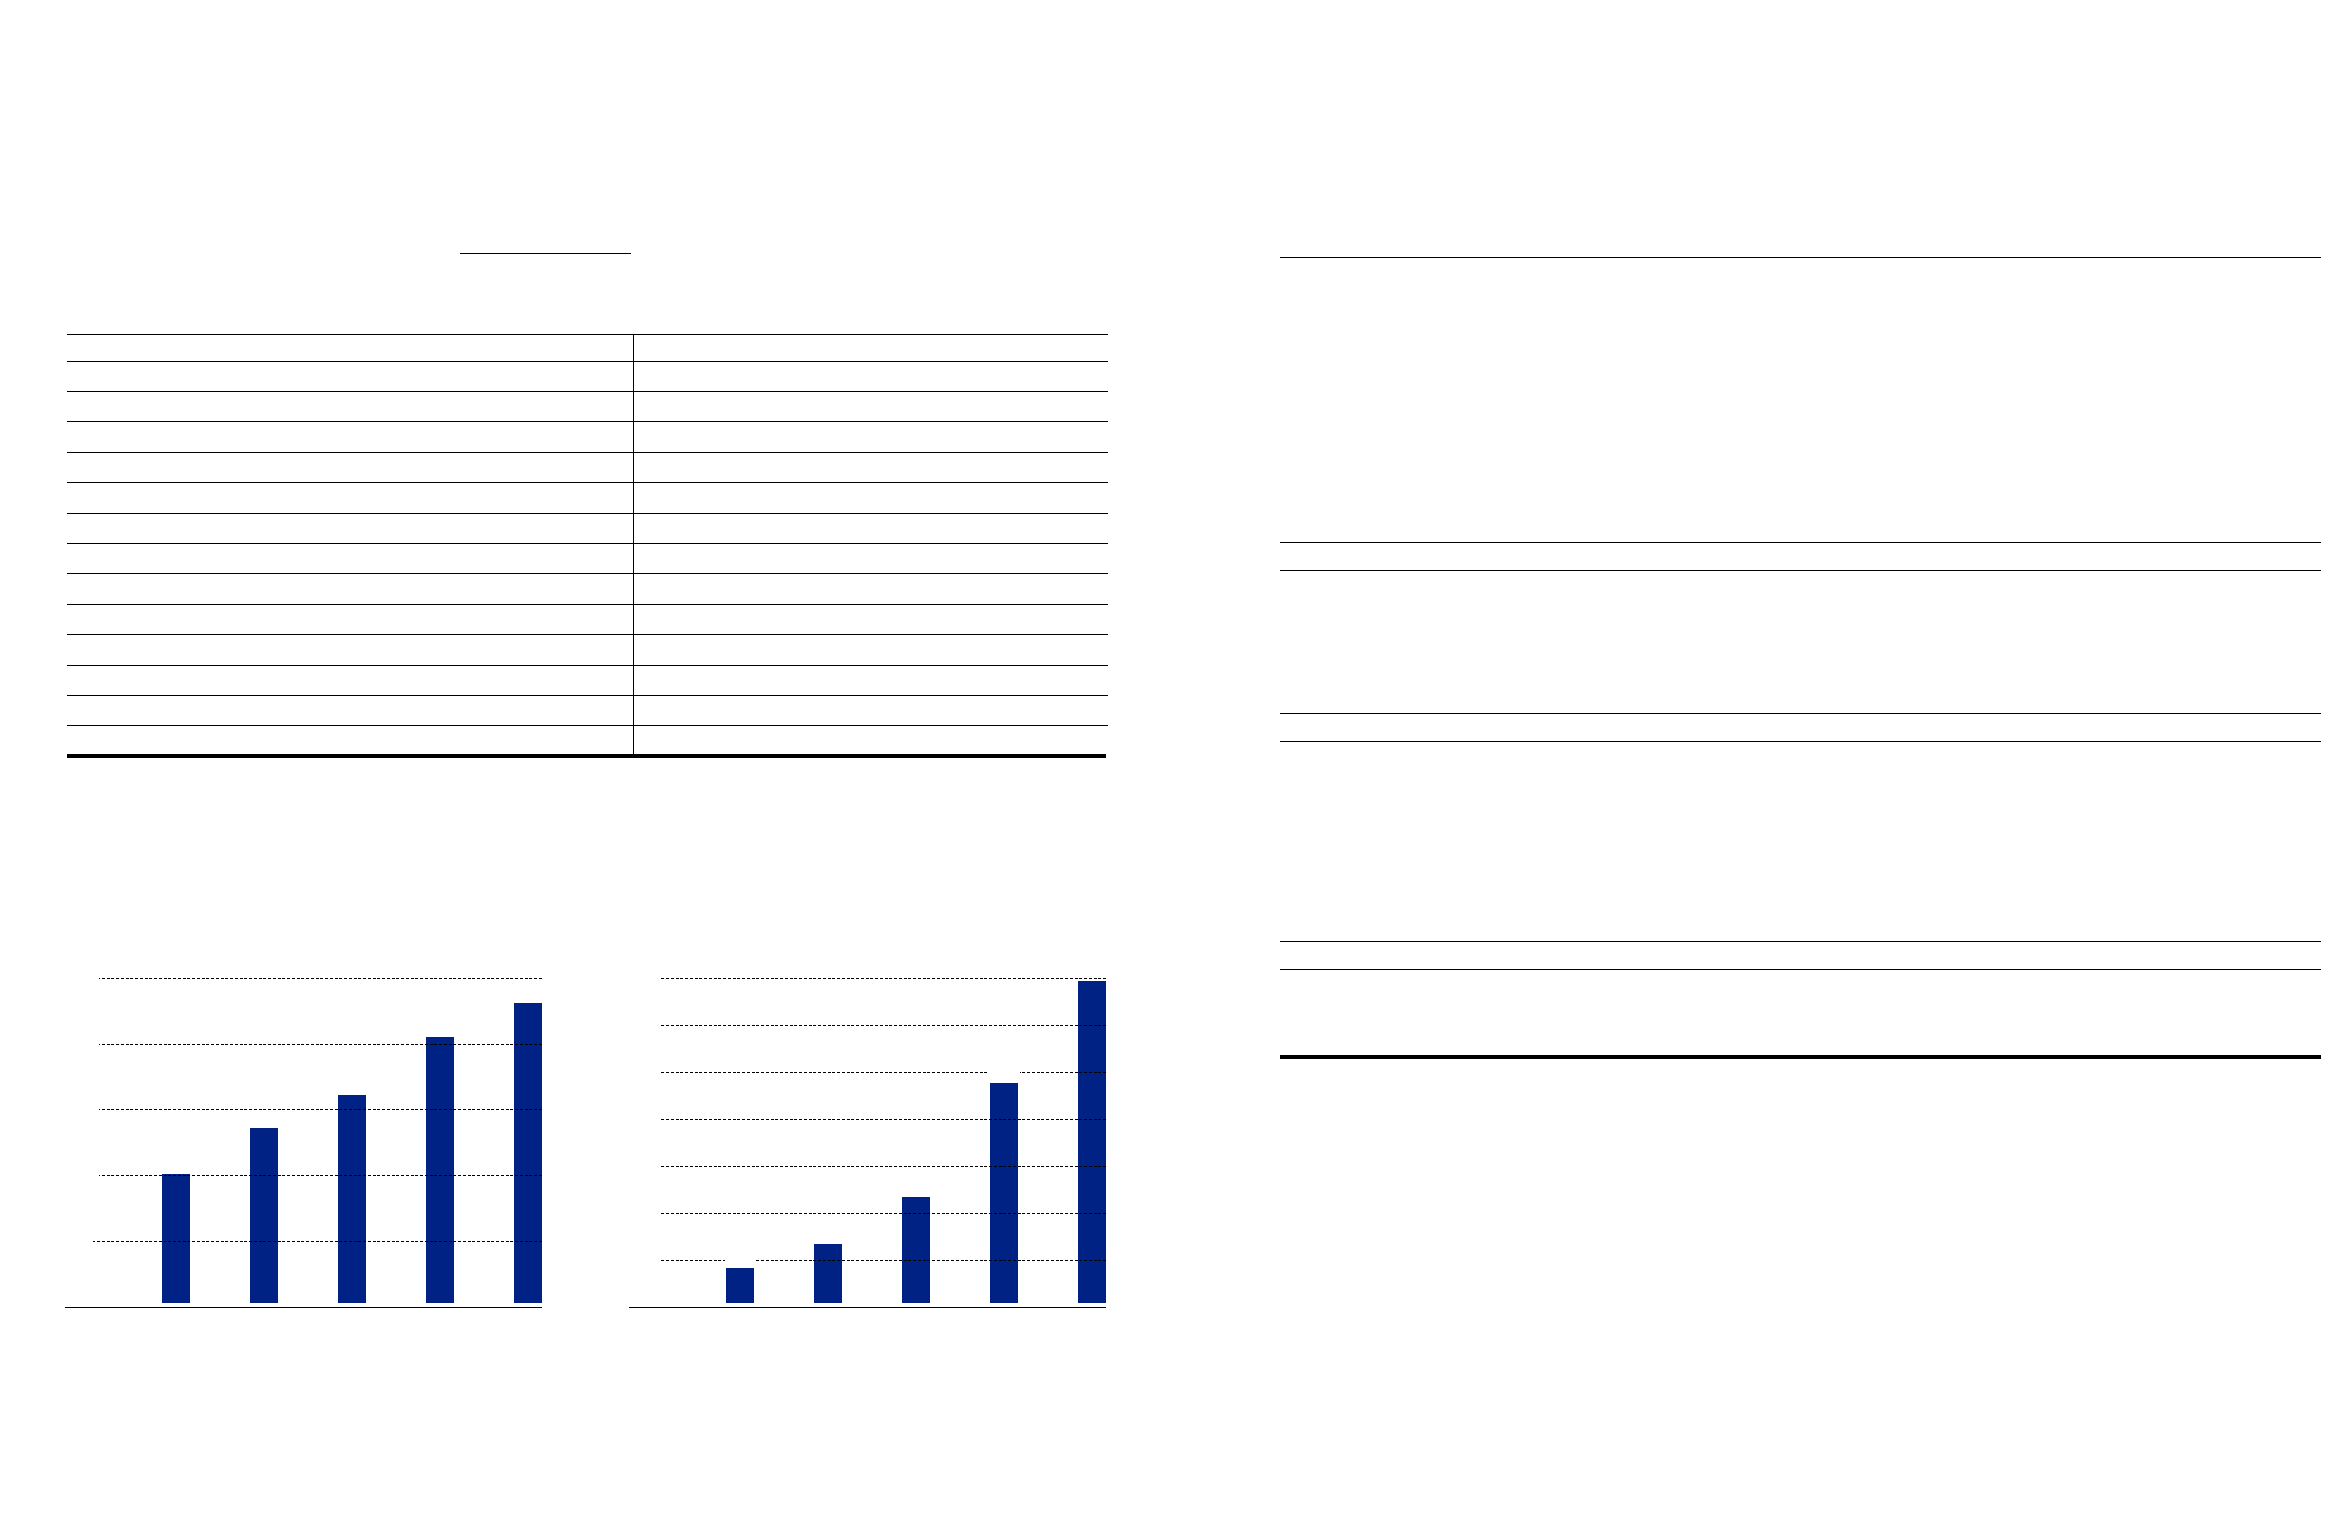
Operating Income (%)
95 96 97 98 99
10.1%
13.7%
16.1%
20.5%
23.2%
25.0%
20.0%
15.0%
10.0%
5.0%
Earning Per Diluted Share
95 96 97 98 99
$1.40
$1.20
$1.00
$0.80
$0.60
$0.40
$0.20 $0.17
$0.27
$0.47
$0.96
$1.39