Abercrombie & Fitch 1999 Annual Report Download - page 10
Download and view the complete annual report
Please find page 10 of the 1999 Abercrombie & Fitch annual report below. You can navigate through the pages in the report by either clicking on the pages listed below, or by using the keyword search tool below to find specific information within the annual report.-
 1
1 -
 2
2 -
 3
3 -
 4
4 -
 5
5 -
 6
6 -
 7
7 -
 8
8 -
 9
9 -
 10
10 -
 11
11 -
 12
12 -
 13
13 -
 14
14 -
 15
15 -
 16
16 -
 17
17 -
 18
18 -
 19
19 -
 20
20 -
 21
21
 |
 |

most merchandise categories. In addition, buying and occu-
pancy costs, expressed as a percentage of net sales, declined
slightly due to leverage achieved from comparable store sales
increases. The Company also improved the gross income rate
through reduced freight costs and enhanced store inventory
control procedures which reduced shrink cost.
In 1998, the gross income rate increased to 42.2% from 38.5%
in 1997. The improvement was the result of higher merchan-
dise margins, expressed as a percentage of net sales due to
higher IMU across most major merchandise categories and a
lower markdown rate. In addition, buying and occupancy
costs, expressed as a percentage of net sales, declined due to
leverage achieved from comparable store sales increases.
GENERAL, ADMINISTRATIVE AND STORE OPERATING
EXPENSES General, administrative and store operating
expenses, expressed as a percentage of net sales, were 17.9% in
the fourth quarter of 1999 and 16.9% in the comparable period
in 1998. The increase in the rate was primarily due to a change
in the accounting for gift certificates. Excluding the impact of
the accounting change, the rate would have improved com-
pared to last year primarily due to lower compensation expenses
related to management bonuses and restricted stock grants
awarded to key executives of the Company. Additionally, the
Company did not incur expenses related to service agreements
with The Limited, Inc. that expired prior to the fourth quarter
of 1999 and emphasized tighter expense control in travel, relo-
cation and legal expenses.
General, administrative and store operating expenses for
the year, expressed as a percentage of net sales, were 21.4%,
21.7% and 22.4% in 1999, 1998 and 1997. The improvement
during the three-year period resulted from management’s
continued emphasis on expense control and favorable lever-
aging of expenses due to higher sales volume. The 1998
improvement was offset by compensation expense associated
with restricted stock grants of approximately $11.5 million.
OPERATING INCOME Operating income, expressed as a per-
centage of net sales, was 34.1%, 32.4% and 27.9% for the fourth
quarter of 1999, 1998 and 1997 and 23.2%, 20.5% and 16.1% for
fiscal years 1999, 1998 and 1997. The improvement was the
result of higher gross income coupled with lower general, admin-
increase in comparable store sales and sales attributable to new
and remodeled stores. Comparable store sales increases were strong
in both the men’s and women’s businesses and across all geographic
regions of the country. The A&F Quarterly accounted for 2.0% of
net sales in the fourth quarter of 1998 as compared to 1.7% in 1997.
Net sales for 1999 increased 28% to $1.04 billion from $815.8
million a year ago. Sales growth resulted from a comparable
store sales increase of 10% and the addition of 54 new stores.
Comparable store sales increases were driven by both men’s and
women’s knits and pants. Net retail sales per gross square foot for
the Company increased 6%, principally from an increase in the
number of transactions per store. The Company’s catalogue, the
A&F Quarterly and the Company’s website represented 2.6% of
1999 net sales compared to 1.8% last year.
Net sales for 1998 increased 56% to $815.8 million over the same
period in 1997. The sales increase was attributable to the net
addition of 40 stores and a 35% comparable store sales increase.
Comparable store sales increases were equally strong in both
men’s and women’s businesses and their performance strength was
broadly based across all major merchandise categories. Net retail
sales per gross square foot for the Company increased 28%, driven
principally by an increase in the number of transactions per store.
GROSS INCOME Gross income, expressed as a percentage of
net sales, increased to 51.9% for the fourth quarter of 1999 from
49.3% for the same period in 1998. The increase was attributable
to higher merchandise margins (representing gross income before
the deduction of buying and occupancy costs), resulting from
higher initial markups (IMU), and improved control of store
inventory shrinkage and merchandise freight costs. The Company
also achieved some leverage in buying and occupancy costs,
expressed as a percentage of net sales.
For the fourth quarter of 1998, gross income, expressed as a
percentage of net sales, increased to 49.3% from 45.4% for the
same period in 1997. The increase was attributable to significant
leverage in buying and occupancy costs, expressed as a percent-
age of net sales associated with increased comparable store sales.
Merchandise margins improved primarily due to a lower mark-
down rate as the Company efficiently managed inventories.
For the year, the gross income rate increased to 44.7% in 1999
from 42.2% in 1998. Merchandise margins, expressed as a per-
centage of net sales, increased due to slightly higher IMU across
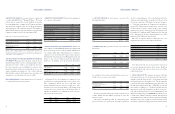
RESULTS OF OPERATIONS Net sales for the fourth quarter
were $367.9 million, an increase of 21% from $304.6 million
for the fourth quarter a year ago. Operating income was $125.3
million, up 27% compared to $98.7 million last year. Net income
per diluted share was $.73, up 30% from $.56 last year.
Net sales for the fiscal year ended January 29, 2000, increased
28% to $1.04 billion from $815.8 million last year. Operating
income for the year increased 45% to $242.1 million from $167.0
million in 1998. Net income per diluted share was $1.39 com-
pared to $.96 a year ago, an increase of 45%.
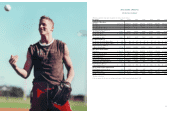
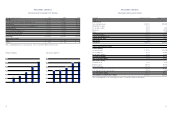
FINANCIAL SUMMARY The following summarized financial
data compares the 1999 fiscal year to the comparable periods
for 1998 and 1997:
% Change
1999- 1998-
1999 1998 1997 1998 1997
Net sales (millions) $1,042.1 $815.8 $521.6 28% 56%
Increase in comparable store sales 10% 35% 21%
Retail sales increase attributable
to new and remodeled stores,
magazine, catalogue and website 18% 21% 34%
Retail sales per average
gross square foot $0,512 $0,483 $0,376 6% 28%
Retail sales per average store
(thousands) $4,550 $4,551 $3,653 – 25%
Average store size at year-end
(gross square feet) 8,695 9,140 9,755 (5%) (6%)
Gross square feet at year-end
(thousands) 2,174 1,791 1,522 21% 18%
Number of stores
Beginning of year 196 156 127
Opened 54 41 30
Closed (–)(1) (1)
End of year 250 196 156
NET SALES Net sales for the fourth quarter of 1999 increased
21% to $367.9 million from $304.6 million in 1998. The increase
was primarily due to the addition of new stores and a comparable
store sales increase of 3%. Comparable store increases were driven
by men’s pants and knits while the women’s knit business was very
strong. The Company’s catalogue, the A&F Quarterly, a cata-
logue/magazine, and the Company’s website accounted for 3.4% of
net sales in the fourth quarter of 1999 as compared to 2.0 % last year.
Fourth quarter 1998 net sales as compared to net sales for the
fourth quarter 1997 increased 44% to $304.6 million, due to a 26%
15
Abercrombie &Fitch Co.
14
MANAGEMENT’S DISCUSSION AND ANALYSIS
Abercrombie &Fitch Co.
istrative and store operating expenses, expressed as a percentage
of net sales. Sales volume and gross income have increased at a
faster rate than general, administrative and store operating
expenses as the Company continues to emphasize cost controls.
INTEREST INCOME/EXPENSE Net interest income was $2.5
million in the fourth quarter of 1999 and $7.3 million for all of
1999 compared with net interest income of $1.6 million and $3.1
million for the corresponding periods last year. Net interest
income in 1999 and 1998 was primarily from short-term invest-
ments. Net interest expense in 1997 included $975 thousand per
quarter associated with $50 million of long-term debt that was
repaid during the first quarter of 1998, offset by interest income
on short-term investments.
FINANCIAL CONDITION The Company’s continuing growth
in operating income provides evidence of financial strength
and flexibility. A more detailed discussion of liquidity, capital
resources and capital requirements follows.
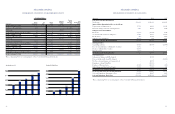
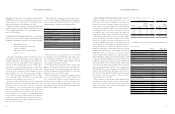
LIQUIDITY AND CAPITAL RESOURCES Cash provided by
operating activities provides the resources to support operations,
including seasonal requirements and capital expenditures. A
summary of the Company’s working capital position and cap-
italization follows (thousands):
1999 1998 1997
Working capital $162,351 $095,890 $ 42,000
Capitalization:
Long-term debt – – $ 50,000
Shareholders’ equity $311,094 $186,105 58,775
Total capitalization $311,094 $186,105 $108,775
The Company considers the following to be measures of
liquidity and capital resources:
1999 1998 1997
Current ratio (current assets divided
by current liabilities) 2.18 1.78 1.63
Debt-to-capitalization ratio (long-term debt
divided by total capitalization) n/a n/a 46%
Cash flow to capital investment
(net cash provided by operating
activities divided by capital expenditures) 183% 413% 340%
n/a=not applicable