Aarons 2004 Annual Report Download - page 3
Download and view the complete annual report
Please find page 3 of the 2004 Aarons annual report below. You can navigate through the pages in the report by either clicking on the pages listed below, or by using the keyword search tool below to find specific information within the annual report.-
 1
1 -
 2
2 -
 3
3 -
 4
4 -
 5
5 -
 6
6 -
 7
7 -
 8
8 -
 9
9 -
 10
10 -
 11
11 -
 12
12 -
 13
13 -
 14
14 -
15
-
16
-
17
-
18
-
19
-
20
-
21
-
22
-
23
-
24
-
25
-
26
-
27
-
28
-
29
-
30
-
31
-
32
-
33
-
34
-
35
-
36
-
37
-
38
-
39
-
40
 |
 |

1
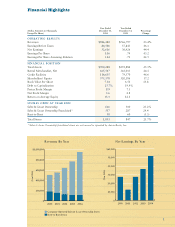
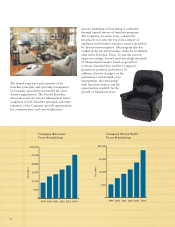
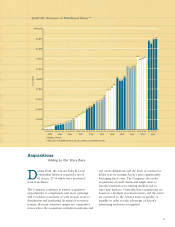
Revenues By Year Net Earnings By Year
Year Ended Year Ended
(Dollar Amounts in Thousands, December 31, December 31, Percentage
Except Per Share) 2004 2003 Change
OPERATING RESULTS
Revenues $946,480 $766,797 23.4%
Earnings Before Taxes 84,506 57,843 46.1
Net Earnings 52,616 36,426 44.4
Earnings Per Share 1.06 .74 43.2
Earnings Per Share Assuming Dilution 1.04 .73 42.5
FINANCIAL POSITION
Total Assets $700,288 $559,884 25.1%
Rental Merchandise, Net 425,567 343,013 24.1
Credit Facilities 116,655 79,570 46.6
Shareholders’ Equity 375,178 320,186 17.2
Book Value Per Share 7.54 6.51 15.8
Debt to Capitalization 23.7% 19.9%
Pretax Profit Margin 8.9 7.5
Net Profit Margin 5.6 4.8
Return on Average Equity 15.1 12.1
STORES OPEN AT YEAR END
Sales & Lease Ownership 616 500 23.2%
Sales & Lease Ownership Franchised* 357 287 24.4
Rent-to-Rent 58 60 (3.3)
Total Stores 1,031 847 21.7%
Financial Highlights
0
200,000
400,000
600,000
800,000
$1,000,000
20042000 2001 2002 2003
Company-Operated Sales & Lease Ownership Stores
Rent-to-Rent Stores
($ in 000s)
0
10,000
20,000
30,000
40,000
50,000
$60,000
20042000 2001 2002 2003
($ in 000s)
* Sales & Lease Ownership franchised stores are not owned or operated by Aaron Rents, Inc.