Aarons 2004 Annual Report Download - page 15
Download and view the complete annual report
Please find page 15 of the 2004 Aarons annual report below. You can navigate through the pages in the report by either clicking on the pages listed below, or by using the keyword search tool below to find specific information within the annual report.-
 1
1 -
2
-
3
-
4
-
 5
5 -
 6
6 -
 7
7 -
 8
8 -
 9
9 -
 10
10 -
 11
11 -
 12
12 -
 13
13 -
 14
14 -
 15
15 -
 16
16 -
 17
17 -
 18
18 -
 19
19 -
 20
20 -
 21
21 -
 22
22 -
 23
23 -
 24
24 -
 25
25 -
26
-
27
-
28
-
29
-
30
-
31
-
32
-
33
-
34
-
35
-
36
-
37
-
38
-
39
-
40
 |
 |

13
Executive Summary
Aaron Rents, Inc. is a leading U.S. company engaged in
the combined businesses of the rental, lease ownership and
specialty retailing of consumer electronics, residential and
office furniture, household appliances, and accessories. As
of December 31, 2004, we had 1,031 stores, which includes
both our Company-operated and franchised stores, and
operated in 45 states, Puerto Rico and Canada.
Our major operating divisions are the Aaron’s Sales &
Lease Ownership division, the Aaron Rents’ Rent-to-Rent
division, and the MacTavish Furniture Industries division.
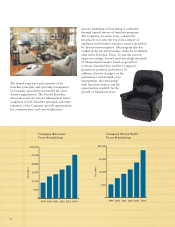
• Our sales and lease ownership division now operates in
excess of 600 stores and has more than 350 franchised
stores in 45 states, Puerto Rico and Canada. Our sales
and lease ownership division represents the fastest
growing segment of our business, accounting for 88%,
86%, and 81% of our total revenues in 2004, 2003,
and 2002, respectively.
• Our rent-to-rent division, which we have operated
since our Company was founded in 1955, remains an
important part of our business. The rent-to-rent division
is one of the largest providers of temporary rental furni-
ture in the United States, operating 58 stores in 14 states
as of December 31, 2004. Over the last few years, we
have consolidated and closed stores in the rent-to-rent
division as we focus on maintaining the profitability of
the division.
• Our MacTavish Furniture Industries division manufac-
tures and supplies nearly one-half of the furniture and
related accessories rented and sold in our stores.
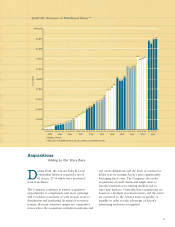
Most of our growth comes from the opening of new
sales and lease ownership stores and increases in same store
revenues for previously opened stores. We added a net of
186 sales and lease ownership stores in 2004, through the
opening of new Company-operated stores, franchise stores,
and acquisitions. We acquire sales and lease ownership stores
from time to time, generally either from small operators of
rental stores or from our franchisees. In 2004, we added 44
stores acquired from other operators and 17 stores acquired
from our franchisees. We expect to open approximately 80
Company-operated stores in 2005. In 2001, we accelerated
the growth of our sales and lease ownership store openings
when we acquired the real estate locations of approximately
80 retail stores from a furniture retailer in bankruptcy pro-
ceedings. While this accelerated schedule depressed our
earnings during the start-up period of these stores, we have
been pleased with the performance of these new locations
which are now accretive to earnings.
We also use our franchise program to help us expand
our sales and lease ownership concept more quickly and
into more areas than we otherwise would by opening only
Company-operated stores. Our franchisees opened 91 stores
in 2004, which included conversion of 10 stores of third
party rental operators and two Company-operated stores
Management’s Discussion and Analysis of Financial Condition and
Results of Operations
to franchise stores. We expect to open approximately 80
franchise stores in 2005. Franchise royalties and other related
fees represent a growing source of revenue for us, accounting
for 2.7%, 2.5%, and 2.6% of our total revenues in 2004,
2003, and 2002, respectively.
Key Components of Income
In this management’s discussion and analysis section,
we review the results of our sales and lease ownership and
rent-to-rent divisions, as well as the four components of
our revenues: rentals and fees, retail sales, non-retail sales
and other revenues. We separate our cost of sales into two
components: retail and non-retail.
Revenues. We separate our total revenues into four
components: rentals and fees, retail sales, non-retail sales,
and other revenues. Rentals and fees includes all revenues
derived from rental agreements from our sales and lease
ownership and rent-to-rent stores, including agreements that
result in our customers acquiring ownership at the end of
the term. Retail sales represents sales of both new and rental
return merchandise from our sales and lease ownership and
rent-to-rent stores. Non-retail sales mainly represents mer-
chandise sales to our franchisees from our sales and lease
ownership division. Other revenues includes franchise fees,
royalty income and other related income from our franchise
stores, and other miscellaneous revenues.
Cost of Sales. We separate our cost of sales into two
components: retail and non-retail. Retail cost of sales
represents the original or depreciated cost of merchandise
sold through our Company-operated stores. Non-retail cost
of sales primarily represents the cost of merchandise sold to
our franchisees.
Depreciation of Rental Merchandise. Depreciation of
rental merchandise reflects the expense associated with
depreciating merchandise held for rent and rented to
customers by our Company-operated sales and lease
ownership and rent-to-rent stores.
Critical Accounting Policies
Revenue Recognition
Rental revenues are recognized in the month they are due
on the accrual basis of accounting. For internal management
reporting purposes, rental revenues from the sales and lease
ownership division are recognized as revenue in the month
the cash is collected. On a monthly basis, we record an
accrual for rental revenues due but not yet received, net of
allowances, and a deferral of revenue for rental payments
received prior to the month due. Our revenue recognition
accounting policy matches the rental revenue with the
corresponding costs, mainly depreciation, associated with
the rental merchandise. At the years ended December 31,
2004 and 2003, we had a revenue deferral representing
cash collected in advance of being due or otherwise earned
totaling approximately $15.9 million and $12.4 million,