Aarons 2004 Annual Report Download - page 18
Download and view the complete annual report
Please find page 18 of the 2004 Aarons annual report below. You can navigate through the pages in the report by either clicking on the pages listed below, or by using the keyword search tool below to find specific information within the annual report.-
 1
1 -
2
-
3
-
4
-
5
-
6
-
7
-
 8
8 -
 9
9 -
 10
10 -
 11
11 -
 12
12 -
 13
13 -
 14
14 -
 15
15 -
 16
16 -
 17
17 -
 18
18 -
 19
19 -
 20
20 -
 21
21 -
 22
22 -
 23
23 -
 24
24 -
 25
25 -
 26
26 -
 27
27 -
 28
28 -
29
-
30
-
31
-
32
-
33
-
34
-
35
-
36
-
37
-
38
-
39
-
40
 |
 |

16
Revenues
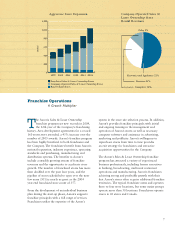
The 19.7% increase in total revenues in 2003 from 2002
is primarily attributable to continued growth in our sales
and lease ownership division from both the opening and
acquisition of new Company-operated stores and improve-
ment in same store revenues. Revenues for our sales and
lease ownership division increased $137.5 million to $656.5
million in 2003 compared with $519.0 million in 2002, a
26.5% increase. This increase was attributable to a 10.1%
increase in same store revenues and the addition of 136
Company-operated stores since the beginning of 2002. Total
revenues were impacted by a decrease in rent-to-rent division
revenues, which decreased $11.4 million to $110.3 million
in 2003 from $121.7 million in 2002, a 9.3% decrease, due
primarily to a decline in same store revenues as well as a net
reduction of 15 stores since the beginning of 2002.
The 20.6% increase in rentals and fees revenues was
attributable to a $100.9 million increase from our sales and
lease ownership division related to the growth in same store
revenues and the increase in the number of stores described
above. The growth in our sales and lease ownership division
was offset by a $6.3 million decrease in rental revenues in
our rent-to-rent division. The decrease in rent-to-rent division
revenues is primarily the result of the decline in same store
revenues and the net reduction in stores described above.
Revenues from retail sales fell 5.4% due to a decrease of
$4.6 million in our rent-to-rent division caused by the decline
in same store revenues and the store closures described
above, partially offset by an increase of $0.7 million in our
sales and lease ownership division caused by the increase in
same store revenues and the increase in the number of stores
also described above. This increase in our sales and lease
ownership division was negatively impacted by the intro-
duction of an alternative shorter-term lease, which replaced
many retail sales.
The 35.3% increase in non-retail sales in 2003 reflects the
significant growth of our franchise operations.
The 20.4% increase in other revenues was primarily
attributable to franchise fees, royalty income, and other
related revenues from our franchise stores increasing $2.7
million, or 16.5%, to $19.3 million compared with $16.6
million to establish a rental merchandise allowance reserve.
We expect rental merchandise adjustments in the future
under this new method to be materially consistent with
adjustments under the former method. In addition, as dis-
cussed above, the revision of certain estimates related to our
accrual for group health self-insurance resulted in a reduction
in expenses of $1.4 million in 2004, partially offsetting the
merchandise allowance reserve expense.
The 29.5% increase in depreciation of rental merchandise
was driven by the growth of our sales and lease ownership
division described above. As a percentage of total rentals and
fees, depreciation of rental merchandise increased slightly
to 36.5% in 2004 from 35.3% in 2003. The increase as a
percentage of rentals and fees reflects increased depreciation
expense as a result of a larger number of short-term leases
in 2004 as described above under retail sales.
The decrease in interest expense as a percentage of total
revenues is primarily due to the growth of our sales and lease
ownership division related to increased same-store revenues
and store count described above.
The 48.9% increase in income tax expense between years
is primarily attributable to a comparable increase in pretax
income in addition to a slightly higher effective tax rate of
37.7% in 2004 compared to 37.0% in 2003 arising from
higher state income taxes.
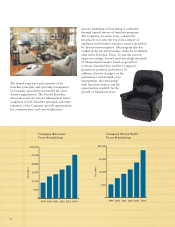
Net Earnings
The 44.4% increase in net earnings was primarily due to
the maturing of Company-operated sales and lease ownership
stores opened and acquired over the past several years; an
11.6% increase in same store revenues; a 29.8% increase in
franchise fees, royalty income, and other related franchise
income; and the recognition of a $3.4 million after-tax
gain on the sale of Rainbow Rentals common stock. As
a percentage of total revenues, net earnings improved to
5.6% in 2004 from 4.8% in 2003.
Year Ended December 31, 2003 Versus Year Ended
December 31, 2002
The following table shows key selected financial data for
the years ended December 31, 2003 and 2002, and the
changes in dollars and as a percentage to 2003 from 2002.
Year Ended Year Ended Increase/ % Increase/
December 31, December 31, (Decrease) in Dollars (Decrease) to
(In Thousands) 2003 2002 to 2003 from 2002 2003 from 2002
REVENUES:
Rentals and Fees $553,773 $459,179 $ 94,594 20.6%
Retail Sales 68,786 72,698 (3,912) (5.4)
Non-Retail Sales 120,355 88,969 31,386 35.3
Other 23,883 19,842 4,041 20.4
766,797 640,688 126,109 19.7
COSTS AND EXPENSES:
Retail Cost of Sales 50,913 53,856 (2,943) (5.5)
Non-Retail Cost of Sales 111,714 82,407 29,307 35.6
Operating Expenses 344,884 293,346 51,538 17.6
Depreciation of Rental Merchandise 195,661 162,660 33,001 20.3
Interest 5,782 4,767 1,015 21.3
708,954 597,036 111,918 18.7
EARNINGS BEFORE INCOME TAXES 57,843 43,652 14,191 32.5
INCOME TAXES 21,417 16,212 5,205 32.1
NET EARNINGS $ 36,426 $ 27,440 $ 8,986 32.7%