Zynga 2015 Annual Report Download - page 108
Download and view the complete annual report
Please find page 108 of the 2015 Zynga annual report below. You can navigate through the pages in the report by either clicking on the pages listed below, or by using the keyword search tool below to find specific information within the annual report.-
 1
1 -
2
-
3
-
4
-
5
-
6
-
7
-
8
-
9
-
10
-
11
-
12
-
13
-
14
-
15
-
16
-
17
-
18
-
19
-
20
-
21
-
22
-
23
-
24
-
25
-
26
-
27
-
28
-
29
-
30
-
31
-
32
-
33
-
34
-
35
-
36
-
37
-
38
-
39
-
40
-
41
-
42
-
43
-
44
-
45
-
46
-
47
-
48
-
49
-
50
-
51
-
52
-
53
-
54
-
55
-
56
-
57
-
58
-
59
-
60
-
61
-
62
-
63
-
64
-
65
-
66
-
67
-
68
-
69
-
70
-
71
-
72
-
73
-
74
-
75
-
76
-
77
-
78
-
79
-
80
-
81
-
82
-
83
-
84
-
85
-
86
-
87
-
88
-
89
-
90
-
91
-
92
-
93
-
94
-
95
-
96
-
97
-
 98
98 -
 99
99 -
 100
100 -
 101
101 -
 102
102 -
 103
103 -
 104
104 -
 105
105 -
 106
106 -
 107
107 -
 108
108 -
 109
109 -
 110
110 -
 111
111 -
 112
112 -
 113
113 -
 114
114 -
 115
115 -
 116
116 -
 117
117 -
 118
118 -
119
-
120
-
121
-
122
-
123
-
124
-
125
-
126
-
127
-
128
-
129
-
130
-
131
-
132
-
133
-
134
-
135
-
136
-
137
-
138
-
139
-
140
-
141
-
142
-
143
-
144
-
145
-
146
-
147
-
148
-
149
-
150
-
151
 |
 |

Table of Contents
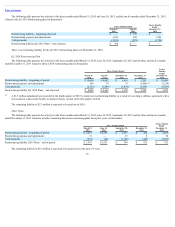
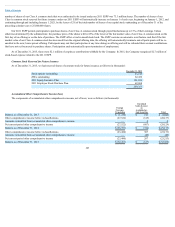
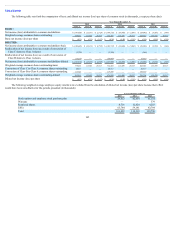
The following table sets forth the computation of basic and diluted net income (loss) per share of common stock (in thousands, except per share data):
Year Ended December 31,
2015 2014 2013
Class A Class B Class C Class A Class B Class C Class A Class B Class C
BASIC:
Net income (loss) attributable to common stockholders $ (103,628) $ (15,153) $ (2,729) $ (189,732) $ (30,869) $ (5,300) $ (29,082) $ (6,951) $ (949)
Weighted-average common shares outstanding 779,071 113,923 20,517 734,493 119,499 20,517 628,947 150,330 20,517
Basic net income (loss) per share $ (0.13) $ (0.13) $ (0.13) $ (0.26) $ (0.26) $ (0.26) $ (0.05) $ (0.05) $ (0.05)
DILUTED:
Net income (loss) attributable to common stockholders-basic $ (103,628) $ (15,153) $ (2,729) $ (189,732) $ (30,869) $ (5,300) $ (29,082) $ (6,951) $ (949)
Reallocation of net income (loss) as a result of conversion of
Class C shares to Class A shares (2,729) — — (5,300) — — (949) — —
Reallocation of net income (loss) as a result of conversion of
Class B shares to Class A shares (15,153) — — (30,869) — — (6,951) — —
Net income (loss) attributable to common stockholders-diluted $ (121,510) $ (15,153) $ (2,729) $ (225,900) $ (30,869) $ (5,300) $ (36,982) $ (6,951) $ (949)
Weighted-average common shares outstanding-basic 779,071 113,923 20,517 734,493 119,499 20,517 628,947 150,330 20,517
Conversion of Class C to Class A common shares outstanding 20,517 — — 20,517 — — 20,517 — —
Conversion of Class B to Class A common shares outstanding 113,923 — — 119,499 — — 150,330 — —
Weighted-average common shares outstanding-diluted 913,511 113,923 20,517 874,509 119,499 20,517 799,794 150,330 20,517
Diluted net income (loss) per share $ (0.13) $ (0.13) $ (0.13) $ (0.26) $ (0.26) $ (0.26) $ (0.05) $ (0.05) $ (0.05)
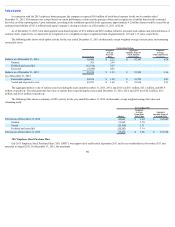
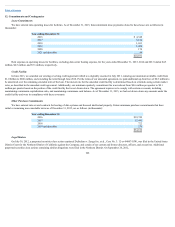
The following weighted-average employee equity awards were excluded from the calculation of diluted net income (loss) per share because their effect
would have been anti-dilutive for the periods presented (in thousands):
Year Ended December 31,
2015 2014 2013
Stock options and employee stock purchase plan 29,412 42,454 61,154
Warrants — — 579
Restricted shares 8,716 12,624 4,203
ZSUs 63,764 59,141 63,794
Total 101,892 114,219 129,730
105