Zynga 2015 Annual Report Download - page 10
Download and view the complete annual report
Please find page 10 of the 2015 Zynga annual report below. You can navigate through the pages in the report by either clicking on the pages listed below, or by using the keyword search tool below to find specific information within the annual report.
Table of Contents
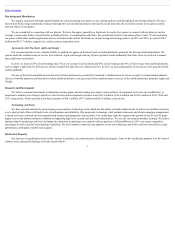
Marketing and Distribution
We acquire our players through unpaid channels by cross-promoting new games to our existing audience and through paid advertising channels. We have
been able to build a large community of players through the viral and sharing features provided by social networks, the social innovations in our games and the
network effects of our games.
We are committed to connecting with our players. We have fan pages, generally on Facebook, for each of our games to connect with our players; and we
leverage various other forms of social media, including Twitter, to communicate with them. We periodically host live and online player events. We also advertise
our games within other mobile applications and on social networks such as Facebook via various in-app advertising partners. In 2015 and 2014, we spent $128.9
million and $101.7 million, respectively, on these player acquisition costs.
AgreementswithFacebook,AppleandGoogle
Our revenue depends on our continued ability to publish our games on Facebook and on mobile platforms, primarily the iOS and Android platforms. We
operate under the standard terms of service for Facebook, Apple and Google and any of these operators could unilaterally alter their terms of service in a manner
that could harm our business.
In 2015, we derived 29% of our bookings and 33% of our revenue from Facebook and 68% of our bookings and 64% of our revenue from mobile platforms,
such as Apple’s App Store for iOS devices and the Google Play App Store for Android devices. In 2015, an increasing number of our players were generated from
mobile platforms.
Our use of the Facebook platform and data derived from Facebook is governed by Facebook’s standard terms of service except for certain limited addenda.
Our use of mobile platforms and data derived from mobile platforms is also governed by the standard terms of service of the mobile platforms, primarily Apple and
Google.
Research and Development
We believe continued investment in enhancing existing games and developing new games, and in software development tools and code modification, is
important to attaining our strategic objectives. Our research and development expenses were $361.9 million, $396.6 million and $413.0 million in 2015, 2014 and
2013, respectively, which included stock-based expense of $94.5 million, $83.7 million and $61.9 million, respectively.
TechnologyandTools.
We have invested extensively in developing our proprietary technology stack, which has the ability to handle sudden bursts of activity for millions of players
over a short period of time with high levels of performance and reliability. Our proprietary technology stack includes datacenter and cloud computing management,
a shared code base, network and cross-promotional features and proprietary data analytics. Our technology stack also supports the growth of our 2D and 3D game
engines across the mobile business in addition to supporting high-level security and anti-fraud infrastructure. We are also investing in machine learning. We believe
that investing in technology and tools, including the simulation technologies we acquired with our purchase of NaturalMotion in 2014, can create competitive
advantages as well as extend our technology leadership. We will continue to innovate and optimize across our technology and tools to deliver cost-effective, high
performance and highly available social games.
Intellectual Property
Our business is significantly based on the creation, acquisition, use and protection of intellectual property. Some of this intellectual property is in the form of
software code, patented technology and trade secrets that we
7

