Yamaha 2005 Annual Report Download - page 17
Download and view the complete annual report
Please find page 17 of the 2005 Yamaha annual report below. You can navigate through the pages in the report by either clicking on the pages listed below, or by using the keyword search tool below to find specific information within the annual report.-
 1
1 -
2
-
3
-
4
-
5
-
6
-
 7
7 -
 8
8 -
 9
9 -
 10
10 -
 11
11 -
 12
12 -
 13
13 -
 14
14 -
 15
15 -
 16
16 -
 17
17 -
 18
18 -
 19
19 -
 20
20 -
 21
21 -
 22
22 -
 23
23 -
 24
24 -
 25
25 -
 26
26 -
 27
27 -
28
-
29
-
30
-
31
-
32
-
33
-
34
-
35
-
36
-
37
-
38
-
39
-
40
-
41
-
42
-
43
-
44
-
45
-
46
-
47
-
48
-
49
-
50
-
51
-
52
-
53
-
54
-
55
-
56
-
57
-
58
-
59
-
60
-
61
-
62
-
63
-
64
-
65
-
66
-
67
-
68
-
69
-
70
-
71
-
72
-
73
-
74
-
75
-
76
-
77
-
78
 |
 |

Yamaha Annual Report 2005 15
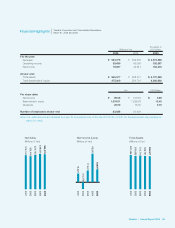
Breakdown of Net Sales Net Sales (Millions of yen) Operating Income (Loss) (Millions of yen)
302,617
293,430
292,647
286,920
284,901
2001/3 2002/3 2003/3 2004/3 2005/3
14,183
10,480
9,792
4,738
12,290
2001/3 2002/3 2003/3 2004/3 2005/3
77,720
78,257
83,670
95,214
100,197
CDR
2001/3 2002/3 2003/3 2004/3 2005/3
3,651
4,418
3,250
3,037
3,904
2001/3 2002/3 2003/3 2004/3 2005/3
(24)
1,462
461
1,046
892
2001/3 2002/3 2003/3 2004/3 2005/3
42,844
44,765
46,031
45,714
46,944
2001/3 2002/3 2003/3 2004/3 2005/3
19,970
30,018
19,282
4,351
6,654
2001/3 2002/3 2003/3 2004/3 2005/3
69,048
76,892
60,554
36,628
43,221
2001/3 2002/3 2003/3 2004/3 2005/3
23,557
26,061
20,956
18,339
22,067
2001/3 2002/3 2003/3 2004/3 2005/3
168
(211)
365
(389)
543
2001/3 2002/3 2003/3 2004/3 2005/3
18,290
20,100
20,903
21,590
21,771
2001/3 2002/3 2003/3 2004/3 2005/3
(2,253)
(1,110)
(1,110)
(1,741)
(1,283)
2001/3 2002/3 2003/3 2004/3 2005/3
56.7%
14.6%
8.0%
12.9%
3.4%
4.4%