Yamaha 2005 Annual Report Download - page 11
Download and view the complete annual report
Please find page 11 of the 2005 Yamaha annual report below. You can navigate through the pages in the report by either clicking on the pages listed below, or by using the keyword search tool below to find specific information within the annual report.-
 1
1 -
 2
2 -
 3
3 -
 4
4 -
 5
5 -
 6
6 -
 7
7 -
 8
8 -
 9
9 -
 10
10 -
 11
11 -
 12
12 -
 13
13 -
 14
14 -
 15
15 -
 16
16 -
 17
17 -
 18
18 -
 19
19 -
 20
20 -
 21
21 -
 22
22 -
23
-
24
-
25
-
26
-
27
-
28
-
29
-
30
-
31
-
32
-
33
-
34
-
35
-
36
-
37
-
38
-
39
-
40
-
41
-
42
-
43
-
44
-
45
-
46
-
47
-
48
-
49
-
50
-
51
-
52
-
53
-
54
-
55
-
56
-
57
-
58
-
59
-
60
-
61
-
62
-
63
-
64
-
65
-
66
-
67
-
68
-
69
-
70
-
71
-
72
-
73
-
74
-
75
-
76
-
77
-
78
 |
 |

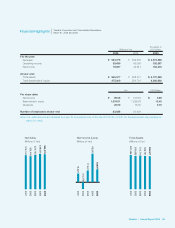
534,079
539,506
524,763
504,406
519,104 2001
2002
2003
2004
2005
19,697
43,541
17,947
(10,274)
13,320 2001
2002
2003
2004
2005
505,577
508,731
512,716
509,663
522,486 2001
2002
2003
2004
2005
For the year:
Net sales
Operating income
Net income
At year-end:
Total assets
Total shareholders’ equity
Per share data:
Net income
Shareholders’ equity
Dividends
Number of employees at year-end
2005
$ 4,973,266
332,387
183,416
$ 4,707,859
2,562,622
$ 0.89
12.43
0.19
2004
¥ 539,506
45,056
43,541
¥ 508,731
259,731
¥ 210.63
1,259.28
15.00
23,903
2005
¥ 534,079
35,695
19,697
¥ 505,577
275,200
¥ 95.06
1,334.51
20.00
23,828
Millions of Yen
Thousands of
U.S. Dollars
Yen U.S. Dollars
Note: U.S. dollar amounts are translated from yen, for convenience only, at the rate of ¥107.39 = U.S.$1.00, the approximate rate prevailing on
March 31, 2005.
Financial Highlights Yamaha Corporation and Consolidated Subsidiaries
March 31, 2005 and 2004
Net Sales
(Millions of Yen)
Net Income (Loss)
(Millions of Yen)
Total Assets
(Millions of Yen)
Yamaha Annual Report 2005 09