Xcel Energy 2000 Annual Report Download - page 36
Download and view the complete annual report
Please find page 36 of the 2000 Xcel Energy annual report below. You can navigate through the pages in the report by either clicking on the pages listed below, or by using the keyword search tool below to find specific information within the annual report.-
 1
1 -
2
-
3
-
4
-
5
-
6
-
7
-
8
-
9
-
10
-
11
-
12
-
13
-
14
-
15
-
16
-
17
-
18
-
19
-
20
-
21
-
22
-
23
-
24
-
25
-
 26
26 -
 27
27 -
 28
28 -
 29
29 -
 30
30 -
 31
31 -
 32
32 -
 33
33 -
 34
34 -
 35
35 -
 36
36 -
 37
37 -
 38
38 -
 39
39 -
 40
40
 |
 |

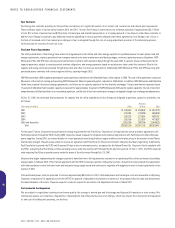
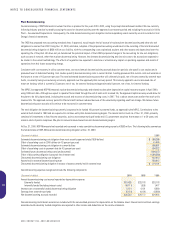
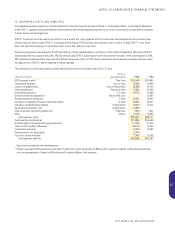
The accounting policies of the segments are the same as those described in Note 1, Summary of Significant Accounting Policies. Xcel Energy evaluates
performance by each legal entity based on profit or loss generated from the product or service provided.
Business Segments
Electric Gas Xcel Energy All Reconciling Consolidated
(Thousands of dollars) Utility Utility NRG International e prime Other Eliminations Total
2000
Operating revenues
from external customers*$6,492,194 $1,466,478 $2,014,757 $1,269,506 $162,566 $11,405,501
Intersegment revenues 1,179 5,761 2,256 53,928 78,419 $(137,962) 3,581
Equity in earnings (losses) of
unconsolidated affiliates 142,086 $35,327 1,203 4,098 182,714
Total revenues $6,493,373 $1,472,239 $2,159,099 $35,327 $1,324,637 $245,083 $(137,962) $11,591,796
Depreciation and
amortization 574,018 85,353 123,404 178 569 8,873 792,395
Financing costs,
mainly interest expense 333,512 60,755 295,917 7,887 200 57,614 (59,780) 696,105
Income tax expense (credit) 261,942 36,962 92,474 (604) (3,995) (81,914) 304,865
Segment income (loss) before
extraordinary items $ 340,634 $ 57,911 $ 182,935 $29,325 $ (6,158) $ (43,250) $ (15,609) $ 545,788
Extraordinary items, net of tax (18,960) (18,960)
Segment net income (loss) $ 321,674 $ 57,911 $ 182,935 $29,325 $ (6,158) $ (43,250) $ (15,609) $ 526,828
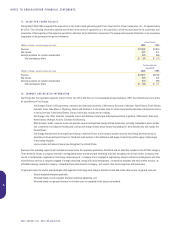
Electric Gas Xcel Energy All Reconciling Consolidated
(Thousands of dollars) Utility Utility NRG International e prime Other Eliminations Total
1999
Operating revenues
from external customers*$5,454,958 $1,141,294 $427,567 $564,045 $114,587 $7,702,451
Intersegment revenues 1,303 11,785 963 2,102 119,546 $(134,731) 968
Equity in earnings (losses) of
unconsolidated affiliates 68,947 $ 44,908 1,467 (3,198) 112,124
Total revenues $5,456,261 $1,153,079 $497,477 $ 44,908 $567,614 $230,935 $(134,731) $7,815,543
Depreciation and
amortization 546,794 82,206 37,026 182 3,762 14,005 683,975
Financing costs,
mainly interest expense 300,108 53,217 92,570 714 226 25,262 (19,020) 453,077
Income tax expense (credit) 272,129 24,081 (26,416) (13,559) (2,984) (59,443) (14,135) 179,673
Segment net income (loss) $ 431,510 $ 49,175 $ 57,195 $ 58,301 $ (4,765) $ (7,362) $ (13,121) $ 570,933
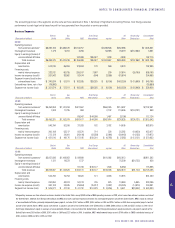
Electric Gas Xcel Energy All Reconciling Consolidated
(Thousands of dollars) Utility Utility NRG International e prime Other Eliminations Total
1998
Operating revenues
from external customers*$5,057,936 $1,109,953 $ 98,688 $181,992 $162,813 $6,611,382
Intersegment revenues 1,131 14,573 1,737 75,209 $(91,722) 928
Equity in earnings (losses) of
unconsolidated affiliates 81,706 $ 38,127 1,504 (5,352) 115,985
Total revenues $5,059,067 $1,124,526 $182,131 $ 38,127 $183,496 $232,670 $(91,722) $6,728,295
Depreciation and
amortization 524,703 75,753 16,320 121 3,438 10,915 631,250
Financing costs,
mainly interest expense 262,654 44,074 50,313 745 675 18,960 5,865 383,286
Income tax expense (credit) 300,103 24,945 (25,654) (15,817) (1,987) (26,225) (14,974) 240,391
Segment net income (loss) $ 505,077 $ 47,180 $ 41,732 $ 51,978 $ (3,256) $ 9,621 $(28,002) $ 624,330
*All operating revenues are from external customers located in the United States except $290 million of NRG operating revenues in 2000, which came from external customers outside of
the United States. However, Xcel Energy International and NRG also have significant equity investments for nonregulated projects outside the United States. NRG’s equity in earnings
of unconsolidated affiliates, primarily independent power projects, includes $19.2 million in 2000, $38.6 million in 1999 and $29.3 million in 1998 from nonregulated projects located
outside of the United States. NRG’s equity investments in projects outside of the United States were $566 million in 2000, $606 million in 1999 and $557 million in 1998. All of
Xcel Energy International’s equity in earnings of unconsolidated affiliates is from outside of the United States. Xcel Energy International’s equity investments and projects outside of the
United States were $383 million in 2000, $367 million in 1999 and $333 million in 1998. In addition, NRG’s wholly owned foreign assets ($796 million in 2000) contributed earnings of
$30.1 million in 2000 and $0 in 1999 and 1998.
XCEL ENERGY INC. AND SUBSIDIARIES
65
NOTES TO CONSOLIDATED FINANCIAL STATEMENTS