World Fuel Services 2012 Annual Report Download - page 5
Download and view the complete annual report
Please find page 5 of the 2012 World Fuel Services annual report below. You can navigate through the pages in the report by either clicking on the pages listed below, or by using the keyword search tool below to find specific information within the annual report.-
 1
1 -
 2
2 -
 3
3 -
 4
4 -
 5
5 -
 6
6 -
 7
7 -
 8
8 -
 9
9 -
 10
10 -
 11
11 -
 12
12 -
 13
13 -
 14
14 -
 15
15 -
 16
16 -
17
-
18
-
19
-
20
-
21
-
22
-
23
-
24
-
25
-
26
-
27
-
28
-
29
-
30
-
31
-
32
-
33
-
34
-
35
-
36
-
37
-
38
-
39
-
40
-
41
-
42
-
43
-
44
-
45
-
46
-
47
-
48
-
49
-
50
-
51
-
52
-
53
-
54
-
55
-
56
-
57
-
58
-
59
-
60
-
61
-
62
-
63
-
64
-
65
-
66
-
67
-
68
-
69
-
70
-
71
-
72
-
73
-
74
-
75
-
76
-
77
-
78
-
79
-
80
-
81
-
82
-
83
-
84
-
85
-
86
-
87
-
88
-
89
-
90
-
91
-
92
-
93
-
94
-
95
-
96
-
97
-
98
-
99
-
100
-
101
-
102
-
103
-
104
-
105
-
106
-
107
-
108
-
109
-
110
-
111
-
112
-
113
-
114
-
115
 |
 |

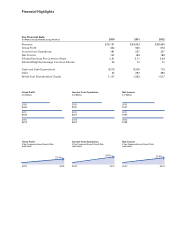
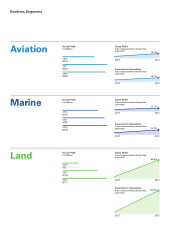
Business Segments
Aviation Gross Profi t
$ in Millions
2010
$215
2012
$295
2 011
$306
Gross Profi t
5-Year Compound Annual Growth Rate
(2007–2012)
20122007
19.1%
Income from Operations
5-Year Compound Annual Growth Rate
(2007–2012)
20122007
16.1%
Marine Gross Profi t
$ in Millions
2010
$165
2012
$208
2 011
$195
Gross Profi t
5-Year Compound Annual Growth Rate
(2007–2012)
20122007
12.7%
Income from Operations
5-Year Compound Annual Growth Rate
(2007–2012)
20122007
15.2%
Land Gross Profi t
5-Year Compound Annual Growth Rate
(2007–2012)
20122007
84.6%
20122007
Income from Operations
5-Year Compound Annual Growth Rate
(2007–2012)
127.4%
Gross Profi t
$ in Millions
2010
$62
2012
$171
2 011
$134