World Fuel Services 2012 Annual Report Download - page 4
Download and view the complete annual report
Please find page 4 of the 2012 World Fuel Services annual report below. You can navigate through the pages in the report by either clicking on the pages listed below, or by using the keyword search tool below to find specific information within the annual report.-
 1
1 -
 2
2 -
 3
3 -
 4
4 -
 5
5 -
 6
6 -
 7
7 -
 8
8 -
 9
9 -
 10
10 -
 11
11 -
 12
12 -
 13
13 -
 14
14 -
 15
15 -
16
-
17
-
18
-
19
-
20
-
21
-
22
-
23
-
24
-
25
-
26
-
27
-
28
-
29
-
30
-
31
-
32
-
33
-
34
-
35
-
36
-
37
-
38
-
39
-
40
-
41
-
42
-
43
-
44
-
45
-
46
-
47
-
48
-
49
-
50
-
51
-
52
-
53
-
54
-
55
-
56
-
57
-
58
-
59
-
60
-
61
-
62
-
63
-
64
-
65
-
66
-
67
-
68
-
69
-
70
-
71
-
72
-
73
-
74
-
75
-
76
-
77
-
78
-
79
-
80
-
81
-
82
-
83
-
84
-
85
-
86
-
87
-
88
-
89
-
90
-
91
-
92
-
93
-
94
-
95
-
96
-
97
-
98
-
99
-
100
-
101
-
102
-
103
-
104
-
105
-
106
-
107
-
108
-
109
-
110
-
111
-
112
-
113
-
114
-
115
 |
 |

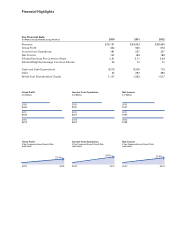
Financial Highlights
Gross Profi t
$ in Millions
2010
$442
2012
$673
2 011
$635
Income from Operations
$ in Millions
2010
$181
2012
$257
2 011
$257
Net Income
$ in Millions
2010
$147
2012
$189
2 011
$194
Gross Profi t
5-Year Compound Annual Growth Rate
(2007–2012)
20122007
22.4%
Income from Operations
5-Year Compound Annual Growth Rate
(2007–2012)
20122007
24.5%
Net Income
5-Year Compound Annual Growth Rate
(2007–2012)
20122007
23.8%
Key Financial Data
$ in Millions Except Diluted Earnings Per Share 2010 2011 2012
Revenue $ 19,131 $ 34,623 $ 38,945
Gross Profit 442 635 673
Income from Operations 181 257 257
Net Income 147 194 189
Diluted Earnings Per Common Share 2.31 2.71 2.64
Diluted Weighted Average Common Shares 63 72 72
Cash and Cash Equivalents $ 273 $ 205 173
Debt 42 287 380
World Fuel Shareholders’ Equity 1,127 1,333 1,517