Windstream 2008 Annual Report Download - page 97
Download and view the complete annual report
Please find page 97 of the 2008 Windstream annual report below. You can navigate through the pages in the report by either clicking on the pages listed below, or by using the keyword search tool below to find specific information within the annual report.-
 1
1 -
2
-
3
-
4
-
5
-
6
-
7
-
8
-
9
-
10
-
11
-
12
-
13
-
14
-
15
-
16
-
17
-
18
-
19
-
20
-
21
-
22
-
23
-
24
-
25
-
26
-
27
-
28
-
29
-
30
-
31
-
32
-
33
-
34
-
35
-
36
-
37
-
38
-
39
-
40
-
41
-
42
-
43
-
44
-
45
-
46
-
47
-
48
-
49
-
50
-
51
-
52
-
53
-
54
-
55
-
56
-
57
-
58
-
59
-
60
-
61
-
62
-
63
-
64
-
65
-
66
-
67
-
68
-
69
-
70
-
71
-
72
-
73
-
74
-
75
-
76
-
77
-
78
-
79
-
80
-
81
-
82
-
83
-
84
-
85
-
86
-
 87
87 -
 88
88 -
 89
89 -
 90
90 -
 91
91 -
 92
92 -
 93
93 -
 94
94 -
 95
95 -
 96
96 -
 97
97 -
 98
98 -
 99
99 -
 100
100 -
 101
101 -
 102
102 -
 103
103 -
 104
104 -
 105
105 -
 106
106 -
 107
107 -
108
-
109
-
110
-
111
-
112
-
113
-
114
-
115
-
116
-
117
-
118
-
119
-
120
-
121
-
122
-
123
-
124
-
125
-
126
-
127
-
128
-
129
-
130
-
131
-
132
-
133
-
134
-
135
-
136
-
137
-
138
-
139
-
140
-
141
-
142
-
143
-
144
-
145
-
146
-
147
-
148
-
149
-
150
-
151
-
152
-
153
-
154
-
155
-
156
-
157
-
158
-
159
-
160
-
161
-
162
-
163
-
164
-
165
-
166
-
167
-
168
-
169
-
170
-
171
-
172
-
173
-
174
-
175
-
176
-
177
-
178
-
179
-
180
 |
 |

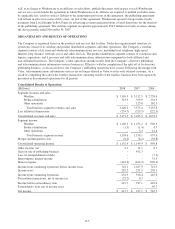
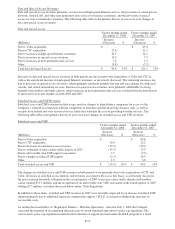
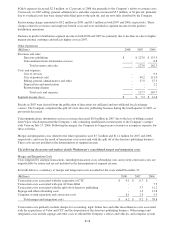
Voice Service Revenues
Voice service revenues consist of traditional telephone services provided to both residential and business customers.
These revenues primarily represent monthly recurring charges for basic services such as local dial-tone and enhanced
services such as caller identification, voicemail and call waiting. The following table reflects the primary drivers of
year-over-year changes in voice service revenues:
Voice service
Twelve months ended
December 31, 2008
Twelve months ended
December 31, 2007
(Millions)
Increase
(Decrease) %
Increase
(Decrease) %
Due to Valor acquisition $ - $ 102.8
Due to CTC acquisition 40.6 20.4
Due to decreases in ala carte calling features (22.0) (18.6)
Due to reductions in expanded calling area rate plans (7.8) (10.9)
Due to decreases in local number portability surcharge (6.0) (3.0)
Due to access line losses and other (56.7) (44.4)
Total voice service $ (51.9) (4)% $ 46.3 4%
The changes in voice service revenues in both 2008 and 2007 were primarily driven by the acquisitions of Valor and
CTC, and the overall decline in access lines discussed above. Additionally, revenues derived from ala carte calling
features and expanded calling area rate plans declined in both periods. The decrease in ala carte calling features, which
includes caller identification, call waiting, call forwarding, voice mail, and other similar services, is due primarily to
the decline in access lines as well as customers electing to discontinue these enhanced services. This decline was
partially offset by targeted pricing increases. In addition, revenues from expanded calling area rate plans have declined
as a result of wireless substitution and migration of customers to packaged long distance rate plans which shifted
revenues from voice service revenues to long distance revenues. Voice service revenues in both periods also decreased
in part due to the expiration during the third quarter of 2007 of a five-year period during which the Company was
allowed to bill customers a surcharge to recover costs associated with local number portability.
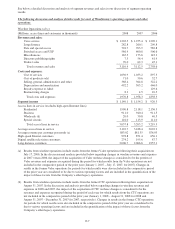
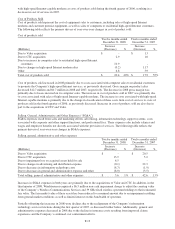
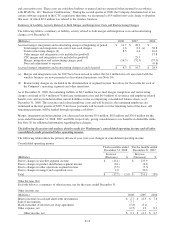
Long Distance Revenues
Long distance revenues are generated from switched interstate and intrastate long distance, long distance calling cards,
international calls and operator services. The following table reflects the primary drivers of year-over-year changes in
long distance revenues:
Long distance
Twelve months ended
December 31, 2008
Twelve months ended
December 31, 2007
(Millions)
Increase
(Decrease) %
Increase
(Decrease) %
Due to Valor acquisition $ - $ 17.4
Due to CTC acquisition 6.8 3.5
Due to increases in customer billing rates 10.4 25.1
Due to increases in packaged plans 25.4 26.2
Due to decreases in one plus calling and other (19.9) (21.9)
Total long distance $ 22.7 9% $ 50.3 24%
Increases in long distance revenues in both periods are primarily due to the acquisitions of Valor and CTC, as
discussed above, increases in customer billing rates and subscriptions to packaged rate plans that offer a defined
number of minutes or unlimited toll calling for a fixed monthly fee. Partially offsetting these increases were declines in
billings on a per minute of use basis (“one plus calling”) primarily attributable to customer migration to long distance
packaged plans and wireless substitution.
F-9