Windstream 2008 Annual Report Download - page 95
Download and view the complete annual report
Please find page 95 of the 2008 Windstream annual report below. You can navigate through the pages in the report by either clicking on the pages listed below, or by using the keyword search tool below to find specific information within the annual report.-
 1
1 -
2
-
3
-
4
-
5
-
6
-
7
-
8
-
9
-
10
-
11
-
12
-
13
-
14
-
15
-
16
-
17
-
18
-
19
-
20
-
21
-
22
-
23
-
24
-
25
-
26
-
27
-
28
-
29
-
30
-
31
-
32
-
33
-
34
-
35
-
36
-
37
-
38
-
39
-
40
-
41
-
42
-
43
-
44
-
45
-
46
-
47
-
48
-
49
-
50
-
51
-
52
-
53
-
54
-
55
-
56
-
57
-
58
-
59
-
60
-
61
-
62
-
63
-
64
-
65
-
66
-
67
-
68
-
69
-
70
-
71
-
72
-
73
-
74
-
75
-
76
-
77
-
78
-
79
-
80
-
81
-
82
-
83
-
84
-
 85
85 -
 86
86 -
 87
87 -
 88
88 -
 89
89 -
 90
90 -
 91
91 -
 92
92 -
 93
93 -
 94
94 -
 95
95 -
 96
96 -
 97
97 -
 98
98 -
 99
99 -
 100
100 -
 101
101 -
 102
102 -
 103
103 -
 104
104 -
 105
105 -
106
-
107
-
108
-
109
-
110
-
111
-
112
-
113
-
114
-
115
-
116
-
117
-
118
-
119
-
120
-
121
-
122
-
123
-
124
-
125
-
126
-
127
-
128
-
129
-
130
-
131
-
132
-
133
-
134
-
135
-
136
-
137
-
138
-
139
-
140
-
141
-
142
-
143
-
144
-
145
-
146
-
147
-
148
-
149
-
150
-
151
-
152
-
153
-
154
-
155
-
156
-
157
-
158
-
159
-
160
-
161
-
162
-
163
-
164
-
165
-
166
-
167
-
168
-
169
-
170
-
171
-
172
-
173
-
174
-
175
-
176
-
177
-
178
-
179
-
180
 |
 |

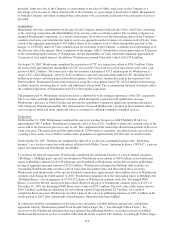
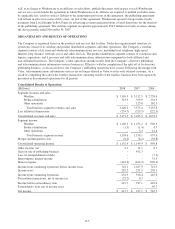
See below a detailed discussion and analysis of segment revenues and sales in our discussion of segment operating
results.
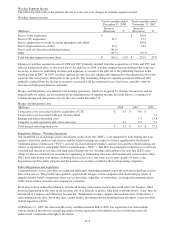
The following discussion and analysis details results for each of Windstream’s operating segments and other
operations.
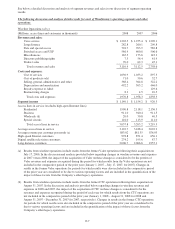
Wireline Operations (a,b,c)
(Millions, access lines and customers in thousands) 2008 2007 2006
Revenues and sales:
Voice service $ 1,203.5 $ 1,255.4 $ 1,209.1
Long distance 282.8 260.1 209.8
Data and special access 794.7 703.9 582.8
Switched access and USF 586.9 600.8 506.6
Miscellaneous 165.5 173.6 143.3
Directory publishing rights 7.5 56.4 61.9
Product sales 70.0 62.3 45.1
Total revenues and sales 3,110.9 3,112.5 2,758.6
Costs and expenses:
Cost of services 1,030.9 1,033.2 897.3
Cost of products sold 71.0 50.6 32.7
Selling, general, administrative and other 368.4 364.8 322.2
Depreciation and amortization 492.2 505.2 446.0
Royalty expense to Alltel - - 129.6
Restructuring charges 8.3 4.5 10.5
Total costs and expenses 1,970.8 1,958.3 1,838.3
Segment income $ 1,140.1 $ 1,154.2 $ 920.3
Access lines in service (excludes high-speed Internet lines)
Residential 1,990.8 2,118.1 2,156.3
Business 911.0 940.4 911.5
Wholesale (d) 20.0 30.8 40.5
Special circuits 116.0 113.9 111.0
Total access lines in service 3,037.8 3,203.2 3,219.3
Average access lines in service 3,122.7 3,188.4 3,022.9
Average revenue per customer per month (e) $83.02 $81.35 $76.05
High-speed Internet customers 978.8 871.4 656.1
Digital satellite television customers 274.2 195.6 87.7
Long distance customers 2,006.7 2,066.6 1,957.1
(a) Results from wireline operations include results from the former Valor operations following their acquisition on
July 17, 2006. In the discussion and analysis provided below regarding changes in wireline revenues and expenses
in 2007 versus 2006, the impact of the acquisition of Valor on these changes is considered to be the portion of
Valor revenues and expenses recognized during the period for which results from the Valor operations are not
included in the comparative period of the prior year (January 1, 2007 – July 17, 2007, for 2007). Changes in
results in the former Valor operations for periods for which results were also included in the comparative period
of the prior year are considered to be due to various operating factors and are included in the quantification of the
impact of those factors from the Company’s other legacy operations.
(b) Results from wireline operations include results from the former CTC operations following their acquisition on
August 31, 2007. In the discussion and analysis provided below regarding changes in wireline revenues and
expenses in 2008 and 2007, the impact of the acquisition of CTC on these changes is considered to be the
revenues and expenses recognized during the period of each year for which results from the CTC operations are
not included in the comparative period of the prior year (January 1, 2008 – August 31, 2008 for 2008 and
August 31, 2007 – December 31, 2007 for 2007, respectively). Changes in results in the former CTC operations
for periods for which results were also included in the comparative period of the prior year are considered to be
due to various operating factors and are included in the quantification of the impact of those factors from the
Company’s other legacy operations.
F-7