Windstream 2008 Annual Report Download - page 166
Download and view the complete annual report
Please find page 166 of the 2008 Windstream annual report below. You can navigate through the pages in the report by either clicking on the pages listed below, or by using the keyword search tool below to find specific information within the annual report.-
 1
1 -
2
-
3
-
4
-
5
-
6
-
7
-
8
-
9
-
10
-
11
-
12
-
13
-
14
-
15
-
16
-
17
-
18
-
19
-
20
-
21
-
22
-
23
-
24
-
25
-
26
-
27
-
28
-
29
-
30
-
31
-
32
-
33
-
34
-
35
-
36
-
37
-
38
-
39
-
40
-
41
-
42
-
43
-
44
-
45
-
46
-
47
-
48
-
49
-
50
-
51
-
52
-
53
-
54
-
55
-
56
-
57
-
58
-
59
-
60
-
61
-
62
-
63
-
64
-
65
-
66
-
67
-
68
-
69
-
70
-
71
-
72
-
73
-
74
-
75
-
76
-
77
-
78
-
79
-
80
-
81
-
82
-
83
-
84
-
85
-
86
-
87
-
88
-
89
-
90
-
91
-
92
-
93
-
94
-
95
-
96
-
97
-
98
-
99
-
100
-
101
-
102
-
103
-
104
-
105
-
106
-
107
-
108
-
109
-
110
-
111
-
112
-
113
-
114
-
115
-
116
-
117
-
118
-
119
-
120
-
121
-
122
-
123
-
124
-
125
-
126
-
127
-
128
-
129
-
130
-
131
-
132
-
133
-
134
-
135
-
136
-
137
-
138
-
139
-
140
-
141
-
142
-
143
-
144
-
145
-
146
-
147
-
148
-
149
-
150
-
151
-
152
-
153
-
154
-
155
-
 156
156 -
 157
157 -
 158
158 -
 159
159 -
 160
160 -
 161
161 -
 162
162 -
 163
163 -
 164
164 -
 165
165 -
 166
166 -
 167
167 -
 168
168 -
 169
169 -
 170
170 -
 171
171 -
 172
172 -
 173
173 -
 174
174 -
 175
175 -
 176
176 -
177
-
178
-
179
-
180
 |
 |

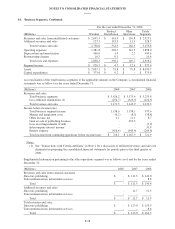
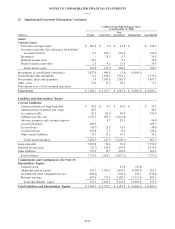
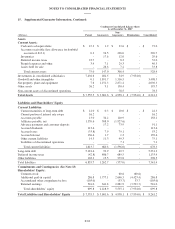
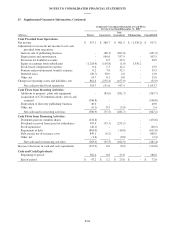
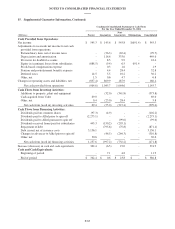
NOTES TO CONSOLIDATED FINANCIAL STATEMENTS
14. Business Segments, Continued:
For the year ended December 31, 2006
(Millions) Wireline
Product
Distribution
Other
Operations
Totals
Segments
Revenues and sales from unaffiliated customers $ 2,635.3 $ 141.0 $ 150.8 $ 2,927.1
Affiliated revenues and sales 123.3 193.9 11.5 328.7
Total revenues and sales 2,758.6 334.9 162.3 3,255.8
Operating expenses 1,381.8 328.7 147.5 1,858.0
Depreciation and amortization 446.0 1.4 2.2 449.6
Restructuring charges 10.5 0.1 - 10.6
Total costs and expenses 1,838.3 330.2 149.7 2,318.2
Segment income $ 920.3 $ 4.7 $ 12.6 $ 937.6
Assets $ 7,897.1 $ 53.8 $ 79.8 $ 8,030.7
Capital expenditures $ 373.6 $ 0.2 $ - $ 373.8
A reconciliation of the total business segments to the applicable amounts in the Company’s consolidated financial
statements was as follows for the years ended December 31:
(Millions) 2008 2007 2006
Revenues and sales:
Total business segments $ 3,426.2 $ 3,575.4 $ 3,255.8
Less affiliated eliminations (1) (254.7) (329.5) (222.5)
Total revenues and sales 3,171.5 3,245.9 3,033.3
Income before income taxes:
Total business segment income 1,138.6 1,158.1 937.6
Merger and integration costs (6.2) (8.2) (38.8)
Other income, net 2.1 11.1 8.7
Gain on sale of publishing business - 451.3 -
Loss on extinguishment of debt - - (7.9)
Intercompany interest income - - 31.9
Interest expense (416.4) (444.4) (209.6)
Total income from continuing operations before income taxes $ 718.1 $ 1,167.9 $ 721.9
Notes:
(1) See “Transactions with Certain Affiliates” in Note 2 for a discussion of affiliated revenues and sales not
eliminated in preparing the consolidated financial statements for periods prior to the third quarter of
2006.
Supplemental information pertaining to the other operations segment was as follows as of and for the years ended
December 31:
(Millions) 2008 2007 2006
Revenues and sales from external customers
Directory publishing $ - $ 111.3 $ 142.0
Telecommunications information services - - 8.8
Total $ - $ 111.3 $ 150.8
Affiliated revenues and sales:
Directory publishing - 11.7 11.5
Telecommunications information services - - -
Total $ - $ 11.7 $ 11.5
Total revenues and sales:
Directory publishing $ - $ 123.0 $ 153.5
Telecommunications information services - - 8.8
Total $ - $ 123.0 $ 162.3
F-78