Western Digital 2010 Annual Report Download - page 5
Download and view the complete annual report
Please find page 5 of the 2010 Western Digital annual report below. You can navigate through the pages in the report by either clicking on the pages listed below, or by using the keyword search tool below to find specific information within the annual report.-
 1
1 -
 2
2 -
 3
3 -
 4
4 -
 5
5 -
 6
6 -
 7
7 -
 8
8 -
 9
9 -
 10
10 -
 11
11 -
 12
12 -
 13
13 -
 14
14 -
 15
15 -
 16
16 -
17
-
18
-
19
-
20
-
21
-
22
-
23
-
24
-
25
-
26
-
27
-
28
-
29
-
30
-
31
-
32
-
33
-
34
-
35
-
36
-
37
-
38
-
39
-
40
-
41
-
42
-
43
-
44
-
45
-
46
-
47
-
48
-
49
-
50
-
51
-
52
-
53
-
54
-
55
-
56
-
57
-
58
-
59
-
60
-
61
-
62
-
63
-
64
-
65
-
66
-
67
-
68
-
69
-
70
-
71
-
72
-
73
-
74
-
75
-
76
-
77
-
78
-
79
-
80
-
81
-
82
-
83
-
84
-
85
-
86
-
87
-
88
-
89
-
90
-
91
-
92
-
93
-
94
-
95
-
96
-
97
-
98
-
99
-
100
-
101
-
102
-
103
-
104
 |
 |

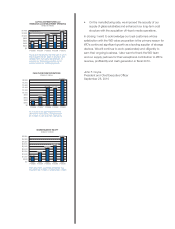
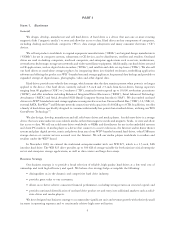
• On the manufacturing side, we improved the security of our
supply of glass substrates and enhanced our long-term cost
structure with the acquisition of Hoya’s media operations.
In closing, I want to acknowledge our loyal customers whose
satisfaction with the WD value proposition is the primary reason for
WD’s continued signicant growth as a leading supplier of storage
devices. We will continue to work passionately and diligently to
earn their ongoing business. I also want to thank the WD team
and our supply partners for their exceptional contribution to WD’s
revenue, protability and cash generation in scal 2010.
John F. Coyne
President and Chief Executive Ofcer
September 28, 2010
$0
$200
$400
$600
$800
$1,000
$1,200
$1,400
$1,600
$1,800
$2,000
FY2006 FY2007 FY2008 FY2009 FY2010
CASH FLOW FROM OPERATIONS
$1,305
$1,399
$1,942
$368
Dollars in millions
$618
As a result of our agile response to the
demand for hard drives, WD generated
$1.9 billion in cash ow from operations.
$0
$500
$1,000
$1,500
$2,000
$2,500
$3,000
$3,500
$4,000
$4,500
$5,000
FY2006 FY2007 FY2008 FY2009 FY2010
SHAREHOLDERS’ EQUITY
$4,709
$2,696
$1,157
Dollars in millions
$1,716
$3,192
WD’s long-term, sustained protability has
resulted in $4.7 billion of shareholders’ equity.
$0
$200
$400
$600
$800
$1,000
$1,200
$1,400
FY2006 FY2007 FY2008 FY2009 FY2010
CAPITAL EXPENDITURES and
RESEARCH and DEVELOPMENT SPENDING
$1,028
$565
Dollars in millions
$630
$1,079
Research & Development
Capital Expenditures $1,348
Fiscal 2010 represents the third year in which
WD invested over $1 billion in research and
development and capital expenditures to
advance our technology position and to
accommodate our continued growth.