Western Digital 2010 Annual Report Download - page 4
Download and view the complete annual report
Please find page 4 of the 2010 Western Digital annual report below. You can navigate through the pages in the report by either clicking on the pages listed below, or by using the keyword search tool below to find specific information within the annual report.-
 1
1 -
 2
2 -
 3
3 -
 4
4 -
 5
5 -
 6
6 -
 7
7 -
 8
8 -
 9
9 -
 10
10 -
 11
11 -
 12
12 -
 13
13 -
 14
14 -
 15
15 -
16
-
17
-
18
-
19
-
20
-
21
-
22
-
23
-
24
-
25
-
26
-
27
-
28
-
29
-
30
-
31
-
32
-
33
-
34
-
35
-
36
-
37
-
38
-
39
-
40
-
41
-
42
-
43
-
44
-
45
-
46
-
47
-
48
-
49
-
50
-
51
-
52
-
53
-
54
-
55
-
56
-
57
-
58
-
59
-
60
-
61
-
62
-
63
-
64
-
65
-
66
-
67
-
68
-
69
-
70
-
71
-
72
-
73
-
74
-
75
-
76
-
77
-
78
-
79
-
80
-
81
-
82
-
83
-
84
-
85
-
86
-
87
-
88
-
89
-
90
-
91
-
92
-
93
-
94
-
95
-
96
-
97
-
98
-
99
-
100
-
101
-
102
-
103
-
104
 |
 |

The growth opportunity in the hard drive market has been created
in large part by our ability to continually drive down average cost
per gigabyte, leading to attractive price points that have driven
mass market adoption of devices incorporating hard drive storage.
At the same time, we have gradually expanded gross margins
while growing revenues by continuously increasing efciencies and
reducing costs.
While remaining highly protable, we have continued to generate
signicant amounts of cash, further strengthening the industry’s
highest quality balance sheet. We generated $1.9 billion in cash
ow from operations during scal 2010. Our cash and cash
equivalent balance of $2.7 billion at the end of the scal year
exceeds our anticipated operating needs and provides us with
operational exibility, the ability to continue to invest in advanced
technology, expand our product breadth through the pursuit of
internal and external opportunities and protect against continued
macro economic uncertainty. We continue to prudently review and
evaluate all available avenues to increase shareholder value with
our strong balance sheet.
Over the course of scal 2010, we derived signicant return on
our continuing investments in technology, new products, and
improvements in our operations:
• We continued to lead the industry’s fastest growing segment—
2.5-inch drives—deploying industry-leading areal density
products at the 640 GB, 750 GB and 1 TB capacity points.
• We made our entry into the traditional enterprise market with
the introduction of our rst 2.5-inch SAS-interface hard drives
for server applications—part of our multi-year investment and
commitment to serve this important and heretofore unserved
market for WD.
• We brought to market our rst client-oriented solid-state drive
(SSD) to complement our existing portfolio of high reliability
embedded SSDs, and we are in development of our rst SSD
for high-end enterprise applications.
• In our branded products business, we broadened our
portfolio of WD storage devices, with the introduction of
My Book® Studio™ LX external hard drives for Apple® users,
and the My Book AV DVR Expander external drives which
allow users to store more of their favorite movies and TV shows
locally. We also extended our family of WD media players with
WD TV® Live™ Plus, featuring added services such as Netix®,
YouTube™, Flickr®, Pandora®, Live365® as well as MediaFly™
that enables consumers to stream their favorite shows and
personal content directly to their TVs. It was also the rst
network media player compatible with Windows® 7.
0.0
10.0
20.0
30.0
40.0
50.0
60.0
70.0
80.0
90.0
FY2006 FY2007 FY2008 FY2009 FY2010
2.5-INCH MOBILE DRIVE SHIPMENTS
5.4
Amounts in millions
12.3
36.6
55.3
80.1
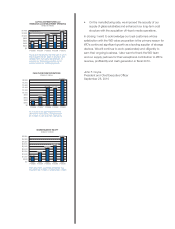
Reecting our technology and product
leadership in this high-growth market, WD
increased mobile drive shipments 45% from
scal 2009.
$0
$200
$400
$600
$800
$1,000
$1,200
$1,400
$1,600
$1,800
$2,000
FY2006 FY2007 FY2008 FY2009 FY2010
BRANDED PRODUCTS REVENUE
$1,445
$1,403
$1,818
$292
Dollars in millions
$871
Our continued strategy to focus on the
industry’s high-growth sector of external
storage resulted in a 26% increase in
branded products revenue from scal 2009,
reecting continued industry leadership in
this market.
REVENUE DIVERSIFICATION*
Dollars in millions
$0
$1,000
$2,000
$3,000
$4,000
$5,000
$6,000
$7,000
$8,000
$9,000
$10,000
FY2006 FY2007 FY2008 FY2009 FY2010
71%
29%
57%
43%
44%
56%
38%
62%
36%
64%
Desktop Revenue
Non-Desktop Revenue
* Revenue percentages are based on sales of hard drives only.
Remaining focused on our goal to diversify
our product set beyond desktop computing,
hard drive revenue from non-desktop markets
expanded to 64% in scal 2010.
$0
$400
$800
$1,200
$1,600
$2,000
$2,400
FY2006 FY2007 FY2008 FY2009 FY2010
CASH and CASH EQUIVALENTS LESS DEBT
$1,312
$2,334
$507
Dollars in millions
$678 $595
WD ended scal 2010 with $2.3 billion of net
cash and cash equivalents, an increase of
$1 billion from scal 2009.