Wendy's 2009 Annual Report Download - page 6
Download and view the complete annual report
Please find page 6 of the 2009 Wendy's annual report below. You can navigate through the pages in the report by either clicking on the pages listed below, or by using the keyword search tool below to find specific information within the annual report.-
 1
1 -
 2
2 -
 3
3 -
 4
4 -
 5
5 -
 6
6 -
 7
7 -
 8
8 -
 9
9 -
 10
10 -
 11
11 -
 12
12 -
 13
13 -
 14
14 -
 15
15 -
 16
16 -
 17
17 -
18
-
19
-
20
-
21
-
22
-
23
-
24
-
25
-
26
-
27
-
28
-
29
-
30
-
31
-
32
-
33
-
34
-
35
-
36
-
37
-
38
-
39
-
40
-
41
-
42
-
43
-
44
-
45
-
46
-
47
-
48
-
49
-
50
-
51
-
52
-
53
-
54
-
55
-
56
-
57
-
58
-
59
-
60
-
61
-
62
-
63
-
64
-
65
-
66
-
67
-
68
-
69
-
70
-
71
-
72
-
73
-
74
-
75
-
76
-
77
-
78
-
79
-
80
-
81
-
82
-
83
-
84
-
85
-
86
-
87
-
88
-
89
-
90
-
91
-
92
-
93
-
94
-
95
-
96
-
97
-
98
-
99
-
100
-
101
-
102
-
103
-
104
-
105
-
106
-
107
-
108
-
109
-
110
-
111
-
112
-
113
-
114
-
115
-
116
-
117
-
118
-
119
-
120
-
121
-
122
-
123
-
124
-
125
-
126
-
127
-
128
-
129
-
130
-
131
-
132
-
133
-
134
-
135
-
136
-
137
-
138
-
139
-
140
-
141
-
142
-
143
-
144
-
145
-
146
-
147
-
148
-
149
-
150
-
151
-
152
-
153
-
154
-
155
-
156
-
157
-
158
-
159
-
160
-
161
-
162
-
163
-
164
-
165
-
166
 |
 |

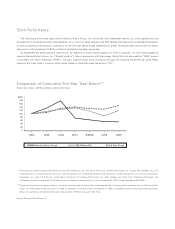
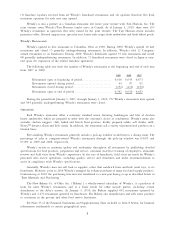
The following performance graph shows Wendy’s/Arby’s Group, Inc. cumulative total shareholder returns (i.e., price appreciation and
reinvestment of dividends and other disbursements) of our Common Stock relative to the S&P Midcap 400 Index and to a specified Peer Group*
of other companies with restaurant operations for the five-year period ended December 31, 2009. The stockholder returns set forth below
assumes an initial investment of $100 and that all dividends have been reinvested.
On September 29, 2008, Wendy’s International, Inc. became a wholly-owned subsidiary of Triarc Companies, Inc. and Triarc changed its
name to Wendy’s/Arby’s Group, Inc. (“Wendy’s/Arby’s”). Also in conjunction with the merger, Wendy’s/Arby’s assumed the “WEN” symbol
on the New York Stock Exchange (“NYSE”). As such, historical stock price information through and including September 29, 2008 reflect
results of the Triarc Class A Common Stock which traded on the NYSE under the symbol “TRY.”
* The companies which comprise the Peer Group are: AFC Enterprises, Inc., Bob Evans Farms, Inc., Brinker International, Inc., Burger King Holdings, Inc., CEC
Entertainment, Inc., Chipotle Mexican Grill, Inc., CKE Restaurants, Inc., Cracker Barrel Old Country Store, Inc., Darden Restaurants, Inc., Denny’s Corporation,
DineEquity, Inc., Jack In The Box Inc., McDonald’s Corporation, P.F. Chang’s China Bistro, Inc., Ruby Tuesday, Inc., Sonic Corp., Starbucks Corporation, The
Cheesecake Factory Incorporated, YUM! Brands, Inc. and Wendy’s International, Inc. (from December 31, 2004 through September 28, 2008).
** The stock price performance graph does not constitute soliciting material and should not be deemed filed or incorporated by reference into any Wendy’s/Arby’s
Group, Inc. filing under the Securities Act of 1933, as amended, or the Securities Exchange Act of 1934, as amended, except to the extent Wendy’s/Arby’s
Group, Inc. specifically incorporates the stock price graph by reference into such other filing.
Source: Research Data Group, Inc.
Comparison of Cumulative Five-Year Total Return**
(Wendy’s/Arby’s Group vs. S&P Midcap 400 Index and Specified Peer Group)
12/0512/04 12/06 12/07 9/29/08 12/08 12/09
Wendy’s/Arby’s Group S&P Midcap 400 Peer Group
0
20
40
60
80
100
120
140
160
180
$200
Stock Performance