Wendy's 2009 Annual Report Download - page 5
Download and view the complete annual report
Please find page 5 of the 2009 Wendy's annual report below. You can navigate through the pages in the report by either clicking on the pages listed below, or by using the keyword search tool below to find specific information within the annual report.
Selected Financial Data
(In Thousands) (Unaudited)
Reconciliation of EBITDA to Adjusted EBITDA
(In Thousands) (Unaudited)
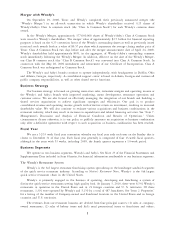
1 The unaudited pro-forma financial statements are based upon the historical consolidated financial statements of Wendy’s/Arby’s Group, Inc. (formerly Triarc Companies,
Inc.) and Wendy’s International, Inc. and have been prepared to illustrate the effect of the merger in which Wendy’s became a wholly-owned subsidiary of Wendy’s/Arby’s
Group, Inc. The pro-forma results of operations are prepared on an “as if” basis which assumes that the merger with Wendy’s occurred at the beginning of 2008 and
includes the effect of the final purchase price allocation.
Disclosure Regarding Non-GAAP Financial Measures
Earnings before interest, taxes, depreciation and amortization (EBITDA) and pro-forma EBITDA are used by the Company as a performance measure for benchmarking
against the Company’s peers and competitors. The Company believes EBITDA and pro-forma EBITDA are useful to investors because they are frequently used by securities
analysts, investors and other interested parties to evaluate companies in the restaurant industry. The Company also uses adjusted EBITDA and pro-forma adjusted EBITDA,
which excludes integration-related expenses included within general and administrative expense, start-up expenses for the Wendy’s purchasing co-op, facilities relocation
and corporate restructuring expenses, pension withdrawal expense included within cost of sales, the one-time benefit from vacation policy standardization and 2008
Wendy’s special committee charges, as an internal measure of business operating performance. The Company believes adjusted EBITDA provides a meaningful perspective of
the underlying operating performance of the Company’s current business. EBITDA, adjusted EBITDA, pro-forma EBITDA, and pro-forma adjusted EBITDA are not recognized
terms under Generally Accepted Accounting Principles (GAAP). Because all companies do not calculate EBITDA or similarly titled financial measures in the same way, those
measures as used by other companies may not be consistent with the way the Company calculates EBITDA or similarly titled financial measures and should not be considered
as alternative measures of operating profit (loss) or net income (loss).
The Company’s presentation of EBITDA, adjusted EBITDA, pro-forma EBITDA, pro-forma adjusted EBITDA and other non-GAAP measures is not intended to replace the
presentation of the Company’s financial results in accordance with GAAP.
Wendy’s/Arby’s Group, Inc. and Subsidiaries
2009 Pro-forma1 2008
53 weeks 52 weeks
Revenues:
Sales $ 3,198,348 $3,279,504
Franchise revenues 382,487 383,137
$ 3,580,835 $3,662,641
EBITDA $ 384,359 $ 274,414
Depreciation and amortization (190,251) (186,601)
Goodwill impairment — (460,075)
Impairment of other long-lived assets (82,132) (20,592)
Operating profit (loss) 111,976 (392,854)
Interest expense (126,708) (100,412)
Investment (expense) income, net (3,008) 15,560
Other than temporary losses on investments (3,916) (112,741)
Other income (expense), net 1,523 (714)
Loss from continuing operations before income taxes (20,133) (591,161)
Benefit from income taxes 23,649 96,918
Income (loss) from continuing operations 3,516 (494,243)
Income from discontinued operations, net of income taxes 1,546 2,217
Net income (loss) $ 5,062 $ (492,026)
2009 Pro-forma1 2008
53 weeks 52 weeks
EBITDA $384,359 $274,414
Plus:
Integration costs in general and administrative (G&A) 16,598 1,857
Wendy’s purchasing co-op start-up costs in G&A 15,500 —
Facilities relocation and corporate restructuring 11,024 6,435
Pension withdrawal expense in cost of sales 4,975 —
Special committee charges — 84,231
Benefit from vacation policy standardization in G&A (3,339) —
Benefit from vacation policy standardization in cost of sales (3,925) —
Adjusted EBITDA $425,192 $366,937
Adjusted EBITDA Growth % 15.9%

