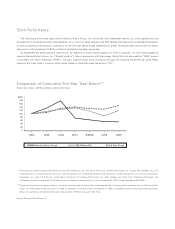
Wendy's 2009 Annual Report Download - page 15
Download and view the complete annual report
Please find page 15 of the 2009 Wendy's annual report below. You can navigate through the pages in the report by either clicking on the pages listed below, or by using the keyword search tool below to find specific information within the annual report.-
 1
1 -
2
-
3
-
4
-
 5
5 -
 6
6 -
 7
7 -
 8
8 -
 9
9 -
 10
10 -
 11
11 -
 12
12 -
 13
13 -
 14
14 -
 15
15 -
 16
16 -
 17
17 -
 18
18 -
 19
19 -
 20
20 -
 21
21 -
 22
22 -
 23
23 -
 24
24 -
 25
25 -
26
-
27
-
28
-
29
-
30
-
31
-
32
-
33
-
34
-
35
-
36
-
37
-
38
-
39
-
40
-
41
-
42
-
43
-
44
-
45
-
46
-
47
-
48
-
49
-
50
-
51
-
52
-
53
-
54
-
55
-
56
-
57
-
58
-
59
-
60
-
61
-
62
-
63
-
64
-
65
-
66
-
67
-
68
-
69
-
70
-
71
-
72
-
73
-
74
-
75
-
76
-
77
-
78
-
79
-
80
-
81
-
82
-
83
-
84
-
85
-
86
-
87
-
88
-
89
-
90
-
91
-
92
-
93
-
94
-
95
-
96
-
97
-
98
-
99
-
100
-
101
-
102
-
103
-
104
-
105
-
106
-
107
-
108
-
109
-
110
-
111
-
112
-
113
-
114
-
115
-
116
-
117
-
118
-
119
-
120
-
121
-
122
-
123
-
124
-
125
-
126
-
127
-
128
-
129
-
130
-
131
-
132
-
133
-
134
-
135
-
136
-
137
-
138
-
139
-
140
-
141
-
142
-
143
-
144
-
145
-
146
-
147
-
148
-
149
-
150
-
151
-
152
-
153
-
154
-
155
-
156
-
157
-
158
-
159
-
160
-
161
-
162
-
163
-
164
-
165
-
166
 |
 |
See “Management Discussion and Analysis—Liquidity and Capital Resources—Guarantees and Other
Contingencies” in Item 7 herein, for further information regarding guarantee obligations.
See Note 5 and Note 21 of the Financial Statements and Supplementary Data included in Item 8 herein,
and the information under “Management’s Discussion and Analysis” in Item 7 herein, for further information
regarding reserves, commitments and contingencies involving franchisees.
Advertising and Marketing
Wendy’s participates in two national advertising funds established to collect and administer funds
contributed for use in advertising through television, radio, newspapers, the Internet and a variety of
promotional campaigns. Separate national advertising funds are administered for Wendy’s U.S and Canadian
locations. Contributions to the national advertising funds are required to be made from both company-owned
and franchised restaurants and are based on a percent of restaurant retail sales. In addition to the contributions
to the national advertising funds, Wendy’s requires additional contributions to be made for both company-
owned and franchised restaurants based on a percent of restaurant retail sales for the purpose of local and
regional advertising programs. Required franchisee contributions to the national advertising funds and for local
and regional advertising programs are governed by the Wendy’s Unit Franchise Agreement. Required
contributions by company-owned restaurants for advertising and promotional programs are at the same percent
of retail sales as franchised restaurants within the Wendy’s system. Currently the contribution rate for U.S. and
Canadian restaurants is generally 3% of retail sales for national advertising and 1% of retail sales for local and
regional advertising.
See Note 24 of the Financial Statements and Supplementary Data included in Item 8 herein, for further
information regarding advertising.
The Arby’s Restaurant System
Arby’s is the largest restaurant franchising system specializing in the roast beef sandwich segment of the
quick service restaurant industry. According to Nation’s Restaurant News, Arby’s is the 2nd largest sandwich
chain restaurant in the United States.
As the franchisor of the Arby’s restaurant system, ARG, through its subsidiaries, owns and licenses the
right to use the Arby’s brand name and trademarks in the operation of Arby’s restaurants. ARG provides
Arby’s franchisees with services designed to increase both the revenue and profitability of their Arby’s
restaurants. The most important of these services are providing strategic leadership for the brand, product
development, quality control, operational training and counseling regarding site selection.
As of January 3, 2010, there were 1,169 company-owned Arby’s restaurants and 2,549 Arby’s restaurants
owned by 470 franchisees. Of the 2,549 franchisee-owned restaurants, 2,427 operated within the United States
and 122 operated outside the United States, principally in Canada. See “Item 2. Properties” for a listing of the
number of Company-owned and franchised locations in the United States and in foreign countries.
The revenues from the Arby’s restaurant business are derived from three principal sources: (1) sales at
company-owned restaurants; (2) franchise royalties received from all Arby’s franchised restaurants; and (3) up-
front franchise fees from restaurant operators for each new unit opened.
ARG also owns the T.J. Cinnamonsconcept, which consists of gourmet cinnamon rolls, gourmet coffees
and other related products. As of January 3, 2010, there were a total of 108 T.J. Cinnamons outlets, 96 of
which are multi-branded with domestic Arby’s restaurants.
Arby’s Restaurants
Arby’s opened its first restaurant in Boardman, Ohio in 1964. During 2009, ARG opened 5 new Arby’s
restaurants and closed 23 generally underperforming Arby’s restaurants. In addition, ARG acquired 12 existing
Arby’s restaurants from its franchisees and sold 1 existing Arby’s restaurant to a franchisee. During 2009,
Arby’s franchisees opened 54 new Arby’s restaurants and closed 74 generally underperforming Arby’s
restaurants. In addition, during 2009, Arby’s franchisees closed 36 T.J. Cinnamons outlets located in Arby’s
units.
8