Wacom 2005 Annual Report Download - page 2
Download and view the complete annual report
Please find page 2 of the 2005 Wacom annual report below. You can navigate through the pages in the report by either clicking on the pages listed below, or by using the keyword search tool below to find specific information within the annual report.-
 1
1 -
 2
2 -
 3
3 -
 4
4 -
 5
5 -
 6
6 -
 7
7 -
 8
8 -
 9
9 -
 10
10 -
 11
11 -
 12
12 -
 13
13 -
14
-
15
-
16
-
17
-
18
-
19
-
20
-
21
-
22
-
23
-
24
-
25
-
26
-
27
-
28
-
29
-
30
-
31
-
32
-
33
-
34
-
35
-
36
 |
 |

944
589
503
114
259
0
200
400
’01 ’02 ’03 ’04 ’05
600
1,000
800
14,109
12,991
12,299
11,246
11,755
0
3,000
6,000
’01 ’02 ’03 ’04 ’05
9,000
12,000
15,000
0
2,000
1,000
(Millions of yen)
(Millions of yen)
(Millions of yen)
(Millions of yen)
3,000
’01 ’02 ’03 ’04 ’05
4,000
5,000
8,000
7,000
6,000
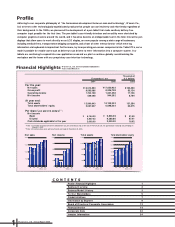
W acom Co., Ltd. and Consolidated Subsidiaries
Years ended March 31
For the year:
N et sales
Gross profit
O perating income
N et income
At year end:
Total assets
Total shareholders’ equity
Per share (yen and U.S. dollars)* * :
N et income
Basic
D iluted
Cash dividends applicable to the year
¥16,514,894
8,585,086
1,702,168
589,098
12,990,943
5,697,957
¥ 6,154.03
5,837.32
2,000.00
$164,363
83,124
17,146
8,794
131,384
62,375
$ 91.50
87.41
18.62
¥17,650,932
8,926,708
1,841,358
944,392
14,109,303
6,698,503
¥ 9,826.49
9,386.80
2,000.00
2004 2005 2005
Thousands of yen
Thousands of
U.S. dollars*
* N ote 1: U .S. dollar amounts have been translated from yen, for convenience only, at the rate of ¥107.39= U .S.$1, the approximate exchange rate prevailing on
March 31, 2005.
* * N ote 2: Common shares were split on a five-for-one basis on N ovember 20, 2003.
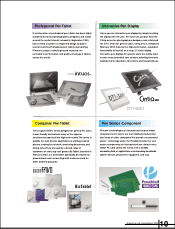
Adhering to our corporate philosophy of “the harmonious development between man and technology”, W acom Co.,
Ltd. strives to offer technologically sophisticated products that people can use intuitively and effortlessly regardless of
their background. In the 1980s, we pioneered the development of a pen tablet that made cordless, battery-free
computer input possible for the first time. The pen tablet’s user-friendly interface and versatility were cherished by
computer graphics creators around the world, and it has since become an indispensable tool in the field. Interactive pen
displays that allow users to work directly on an LCD display, are now popular among a wide range of businesses,
including medical firms, transportation/shipping companies, and a host of other enterprises for which entering
information via keyboards is impractical. Furthermore, by incorporating pen-sensor components into Tablet PCs, we’ve
made it possible for mobile users such as delivery truck drivers to enter information into a computer system. O ur
tablets are continuing to expand into new application areas and we plan to continue globally revolutionizing the
workplace and the home with our proprietary user-interface technology.
17,651
16,515
15,037
12,325
13,158
0
5,000
10,000
’01 ’02 ’03 ’04 ’05
15,000
20,000
W acom Co., Ltd. Annual Report 2005
1
N et sales N et income Total assets
Total shareholders’ equity
6,699
5,698
4,901
4,593
4,359
Profile / Financial Highlights
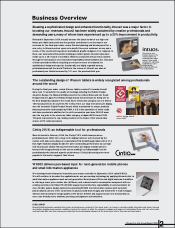
Business O verview
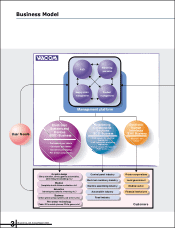
Business Model/ History
To O ur Shareholders
Global Initiatives
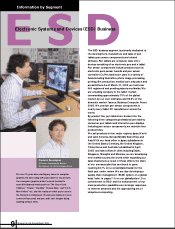
Information by Segment
Board of D irectors/ Corporate Governance
Financial Section
Corporate D ata
Investor Information
1
2
3
5
7
9
13
14
33
34