Wacom 2005 Annual Report Download - page 17
Download and view the complete annual report
Please find page 17 of the 2005 Wacom annual report below. You can navigate through the pages in the report by either clicking on the pages listed below, or by using the keyword search tool below to find specific information within the annual report.-
 1
1 -
2
-
3
-
4
-
5
-
6
-
 7
7 -
 8
8 -
 9
9 -
 10
10 -
 11
11 -
 12
12 -
 13
13 -
 14
14 -
 15
15 -
 16
16 -
 17
17 -
 18
18 -
 19
19 -
 20
20 -
 21
21 -
 22
22 -
 23
23 -
 24
24 -
 25
25 -
 26
26 -
 27
27 -
28
-
29
-
30
-
31
-
32
-
33
-
34
-
35
-
36
 |
 |

16
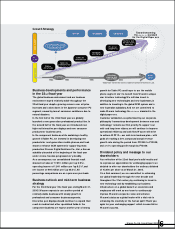
Market Environment and
Business Results
In the fiscal year under review, the Group performed under a
generally favorable business environment. However, the U.S. and
European economies showed signs of slowing down due to such
unfavorable factors as high international oil prices and rising U .S.
interest rates. The Japanese economy faced several challenges,
including stagnant sales of personal computers for consumers,
although we observed positive factors such as special
procurements of digital home electronics in the wake of the
opening of the O lympic Games. W e achieved stable growth in
sales in China and other Asian countries.
As a result, the Group focused its efforts on launching new
products for professionals and consumers and developing markets
for interactive pen displays as well as increasing sales and
reinforcing our development capabilities in the pen sensor
component business. W e also improved efficiency in our
manufacturing operations.
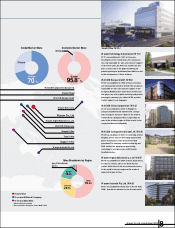
As a result of these efforts, the results of operations for the fiscal
year under review achieved net sales of ¥17,651 million, or U.S.
$164 million (up 6.9% year-on-year); operating income of ¥1,841
million, or U.S. $17 million (up 8.2% year-on-year); and net income
of ¥944 million, or U.S. $9 million (up 60.3% year-on-year).
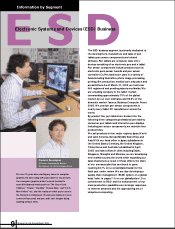
Business Results by Segment
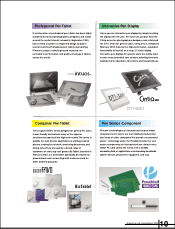
Electronic Systems and D evices (ESD ) Business
The ESD business achieved steady growth, due primarily to strong
performance in the European and U.S. markets. Business in the
Asian market also performed well, although part of our O EM
business in the Chinese market leveled off due to a decline in
demand in the handwritten character recognition market. The
Japanese market slowed for a short period, partly attributable to a
delay in major sales negotiations on interactive pen displays and
the suspension of government subsidies for electronic medical
charts. H owever, we achieved strong sales growth due mainly to
the global launch in September 2004 of Intuos3, a completely
redesigned model featuring upgraded functionality in the Intuos
series, our flagship product line for professionals. In the second half
of the fiscal year we released three new interactive pen display
models, D TU 710, D TI520 and Cintiq 21UX, and achieved
remarkable sales growth. In addition to the existing market for
graphics use, we explored new markets, including corporate users,
by launching a new Biz Tablet for business use. W e also released a
new Bluetooth-enabled wireless tablet model in the
Graphire/FAVO series, a leading product for consumers.
(Millions of yen)
’01 ’02 ’03 ’04 ’05
’01 ’02 ’03 ’04 ’05
N et income per share (basic)
(%)
(%)
RO E/RO A
Total shareholders' equity ratio
0
5,000
10,000
15,000
20,000
25,000
30,000
30
40
50
0
5
10
15
20
37.0
40.9
39.8
43.9
47.5
7.0
4.7
4.3
1.0
2.2
’01
15,003
’02
6,578
’03
28,089
’05
9,826
’04
6,154
15.2
11.1
10.6
(RO E)
(RO A)
6.1
2.5
N ote: Common shares were split on a five-for-one basis on
N ovember 20, 2003.
W acom Co., Ltd. Annual Report 2005
N ote: RO A equals net income/average total assets.