Wacom 2005 Annual Report Download - page 19
Download and view the complete annual report
Please find page 19 of the 2005 Wacom annual report below. You can navigate through the pages in the report by either clicking on the pages listed below, or by using the keyword search tool below to find specific information within the annual report.-
 1
1 -
2
-
3
-
4
-
5
-
6
-
7
-
8
-
 9
9 -
 10
10 -
 11
11 -
 12
12 -
 13
13 -
 14
14 -
 15
15 -
 16
16 -
 17
17 -
 18
18 -
 19
19 -
 20
20 -
 21
21 -
 22
22 -
 23
23 -
 24
24 -
 25
25 -
 26
26 -
 27
27 -
 28
28 -
 29
29 -
30
-
31
-
32
-
33
-
34
-
35
-
36
 |
 |

18
services for corporate clients and to promote greater operational
efficiencies.
EH I sales grew to ¥32 million, or U .S. $0.3 million (up 82.7% year-
on-year), and operating loss decreased to ¥71 million, or U.S. $0.7
million (from operating loss of ¥114 million for the previous fiscal
year).
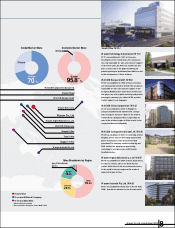
Financial Position
Financial conditions
At the end of the fiscal year under review, consolidated cash and
cash equivalents increased by ¥ 552 million, or U.S. $5 million,
compared to an increase of ¥ 611 million, or U.S. $6 million, for
the previous year, to ¥4,233 million, or U.S. $39 million (up 15.0%
year-on-year), while income before taxes grew to ¥1,717 million,
or U .S. $16 million (up 51.9% year-on-year).
Cash flows from operating activities
N et cash provided by operating activities amounted to ¥1,162
million, or U.S. $11 million (up 8.8% year-on-year), due primarily
to strong income before taxes of ¥1,717 million, or U .S. $16
million, an increase of ¥850 million, or U.S. $8 million, in notes and
accounts payable, depreciation of ¥257 million, or U.S. $2 million,
and amortization of software amounting to ¥117 million, or U.S.
$1 million, despite a payment of ¥433 million, or U.S. $4 million,
for litigation settlement and a payment of ¥ 525 million, or U.S. $5
million, for income taxes.
Cash flows from investing activities
N et cash used in investing activities amounted to ¥24 million, or
U.S. $0.2 million (down 80.7% year-on-year), due primarily to
proceeds of ¥141 million, or U.S. $1 million, from the refund of
time deposits (down 18.7% year-on-year) in spite of payments of
¥198 million, or U.S. $2 million (up 100.9% year-on-year), for
purchases of fixed assets.
Cash flows from financing activities
N et cash used in financing activities amounted to ¥723 million, or
U.S. $7 million (up 457.7% year-on-year), mainly as the combined
result of a net decrease of ¥200 million, or U.S. $2 million, in short-
term borrowings (as compared to a net increase of ¥140 million,
or U .S. $1 million, for the previous fiscal year), the expenditure of
¥188 million, or U.S. $2 million (up 117.5% year-on-year), for
payment of cash dividends and the expenditure of ¥324 million, or
U.S. $3 million (down 47.0% year-on-year), for payment of long-
term debt.
(Millions of yen)
(Millions of yen)
(Millions of yen)
Cash flows from operating activities
Cash flows from investing activities
Cash flows from financing activities
-500
0
500
1,000
1,500
2,000
-1,200
-1,000
-800
-600
-400
-200
0
’01
-258
’02
124
’03
1,774
’05
1,162
’04
1,069
’01
-207
’02
-153
’03
-1,039
’05
-723
’04
-130
-400
-300
-200
-100
0
’01
-390
’02
-232
’03
-184
’05
-24
’04
-125
W acom Co., Ltd. Annual Report 2005