Wacom 2004 Annual Report Download - page 3
Download and view the complete annual report
Please find page 3 of the 2004 Wacom annual report below. You can navigate through the pages in the report by either clicking on the pages listed below, or by using the keyword search tool below to find specific information within the annual report.-
 1
1 -
 2
2 -
 3
3 -
 4
4 -
 5
5 -
 6
6 -
 7
7 -
 8
8 -
 9
9 -
 10
10 -
 11
11 -
 12
12 -
 13
13 -
 14
14 -
15
-
16
-
17
-
18
-
19
-
20
-
21
-
22
-
23
-
24
-
25
-
26
-
27
-
28
 |
 |

Wacom Annual Report 2004 1
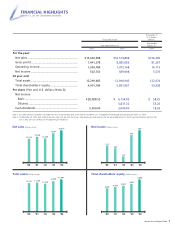
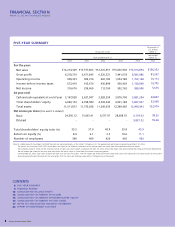
For the year:
Net sales ...............................................................
Gross profit ..........................................................
Operating income................................................
Net income...........................................................
At year end:
Total assets...........................................................
Total shareholders’ equity ..................................
Per share (Yen and U.S. dollars :Note 2):
Net income
Basic...................................................................
Diluted...............................................................
Cash dividends .....................................................
Note 1: U.S. dollar amounts have been translated from yen, for convenience only, at the rate of ¥105.64=U.S.$1, the approximate exchange rate prevailing on March 31, 2004.
¥16,514,894
8,585,086
1,702,168
589,098
12,990,943
5,697,957
¥6,154.03
5,837.32
2,000.00
¥15,036,968
7,441,678
1,034,784
502,763
12,299,482
4,901,184
¥28,088.55
-
5,000.00
$156,332
81,267
16,113
5,576
122,974
53,938
$ 58.25
55.26
18.93
Net sales (Millions of yen) Net income (Millions of yen)
Total assets (Millions of yen) Total shareholders' equity (Millions of yen)
FINANCIAL HIGHLIGHTS
Wacom Co., Ltd. and Consolidated Subsidiaries
’01 ’02 ’03 ’04’00
12,214
13,158 12,325
15,037
16,515
311
259
114
503
589
11,512 11,755 11,246
12,299 12,991
4,090 4,359 4,594 4,901
5,698
Note 2: On November 20, 2003, each share of common stock was split into five shares. Accordingly, per share amounts for the year ended March 31, 2004, were calculated on the basis that
such a stock split was carried out at the beginning of the period.
Thousands of
U.S. dollars
(Note 1)
Year ended
March 31
2004
Thousands of yen
Year ended March 31
2003 2004
’01 ’02 ’03 ’04’00
’01 ’02 ’03 ’04’00 ’01 ’02 ’03 ’04’00