Wacom 2004 Annual Report Download - page 13
Download and view the complete annual report
Please find page 13 of the 2004 Wacom annual report below. You can navigate through the pages in the report by either clicking on the pages listed below, or by using the keyword search tool below to find specific information within the annual report.-
 1
1 -
2
-
 3
3 -
 4
4 -
 5
5 -
 6
6 -
 7
7 -
 8
8 -
 9
9 -
 10
10 -
 11
11 -
 12
12 -
 13
13 -
 14
14 -
 15
15 -
 16
16 -
 17
17 -
 18
18 -
 19
19 -
 20
20 -
 21
21 -
 22
22 -
 23
23 -
24
-
25
-
26
-
27
-
28
 |
 |

Wacom Annual Report 2004 11
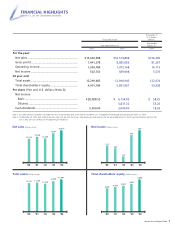
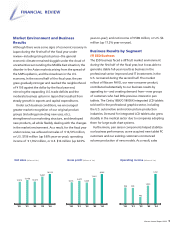
Net income per share (Basic) (Yen) Return on equity (ROE) (%) Total shareholders' equity ratio (%)
$35 million (up 19.9% year-on-year), at the end of the
fiscal year under review, while income before income
taxes grew relatively smoothly to ¥ 1,131 million, or
U.S. $11 million (up 20.8% year-on-year).
Cash flows from operating activities
Net cash provided by operating activities amounted to
¥1,069 million, or U.S. $10 million (down 39.8% year-
on-year), primarily due to income taxes paid of ¥ 777
million, or U.S. $7 million (up 93.5% year-on-year), in
spite of the favorable income before income taxes of
¥1,131 million, or U.S. $11 million.
Cash flows from investing activities
Net cash used in investing activities amounted to ¥ 125
million, or U.S. $1 million (down 32.4% year-on-year),
mainly as the combined result of payments of ¥ 6
million, or U.S. $0.06 million, for additional investment
in Wacom NET Co., Ltd. in the context of making it our
wholly-owned subsidiary; payments of ¥ 97 million, or
U.S. $0.9 million, for purchases of investment securities
to establish a South Korean subsidiary; and proceeds of
¥115 million, or U.S. $1 million, from the refund of
insurance funds.
Cash flows from financing activities
Net cash used in financing activities amounted to ¥ 130
million, or U.S. $1 million (down 87.5% year-on-year),
mainly as the combined result of the expenditure of
¥812 million, or U.S. $8 million (down 45.7% year-on-
year), for payment of long-term borrowings and
proceeds of ¥ 535 million, or U.S. $5 million, from
issuance of stock.
As a result, consolidated total assets and
shareholders' equity as of the end of the fiscal year
under review were ¥ 12,991 million, or U.S. $123
million, and ¥ 5,698 million, or U.S. $54 million,
respectively, with the equity ratio at 43.9% and return
on equity (ROE) at 11.1%.
Source and Application of Funds
Of the net funds of ¥ 472 million procured by means of
the public stock offering on April 24, 2003 (number of
stocks issued: 1,300 shares; issue price: ¥ 390,000), ¥ 58
million was applied to capital expenditures for building
a new business system, and the remaining ¥ 414 million
to working capital.
8.9
6.1
2.5
11.1
’01 ’02 ’03 ’04
24,050
15,003
6,578
28,089
6,154
’00
10.6
’01 ’02 ’03 ’04’00
35.5 37.0 40.9
43.9
39.8
’01 ’02 ’03 ’04’00
*On November 20, 2003, each share of common stock
was split into five shares. Accordingly, the '04 amount was
calculated on the basis that such a stock split was carried out
at the beginning of the period.
*