Vtech 2009 Annual Report Download - page 8
Download and view the complete annual report
Please find page 8 of the 2009 Vtech annual report below. You can navigate through the pages in the report by either clicking on the pages listed below, or by using the keyword search tool below to find specific information within the annual report.-
 1
1 -
 2
2 -
 3
3 -
 4
4 -
 5
5 -
 6
6 -
 7
7 -
 8
8 -
 9
9 -
 10
10 -
 11
11 -
 12
12 -
 13
13 -
 14
14 -
 15
15 -
 16
16 -
 17
17 -
 18
18 -
 19
19 -
20
-
21
-
22
-
23
-
24
-
25
-
26
-
27
-
28
-
29
-
30
-
31
-
32
-
33
-
34
-
35
-
36
-
37
-
38
-
39
-
40
-
41
-
42
-
43
-
44
-
45
-
46
-
47
-
48
-
49
-
50
-
51
-
52
-
53
-
54
-
55
-
56
-
57
-
58
-
59
-
60
-
61
-
62
-
63
-
64
 |
 |

MANAGEMENT DISCUSSION AND ANALYSIS
60
50
40
30
20
10
0
18
15
12
9
6
3
0
6 VTech Holdings Ltd Annual Report 2009
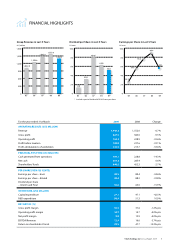
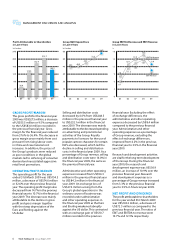
Profit Attributable to Shareholders
in Last 5 Years
US$ million
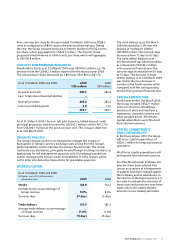
Group R&D Expenditure
in Last 5 Years
US$ million
240
200
160
120
80
40
0
143.2
182.9
215.7
128.8
56.9
12.9
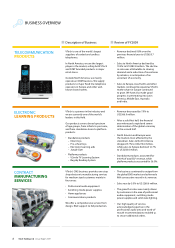
Group EBITDA/Revenue and EBIT/Revenue
in Last 5 Years
%
10.7
16.6
14.7
14.9
13.3
11.3
12.9
6.1
7.9
EBIT/Revenue
EBITDA/Revenue
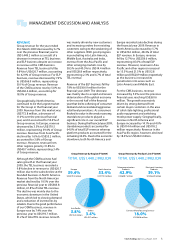
GROSS PROFIT/MARGIN
The gross profit for the financial year
2009 was US$527.5 million, a decrease
of US$55.5 million or 9.5% compared
to the US$583.0 million recorded in
the previous financial year. Gross
margin for the financial year reduced
from 37.6% to 36.4%. The decrease in
gross margin arose mainly from cost
pressure from rising labour costs
in China and raw material cost
increases. In addition, the prices of
the Group’s products were reduced
as poor conditions in the global
markets led to softening of consumer
demand and necessitated aggressive
retail level promotions.
OPERATING PROFIT/MARGIN
The operating profit for the year
ended 31st March 2009 was US$154.3
million, a decrease of US$74.6 million
or 32.6% over the previous financial
year. The operating profit margin also
decreased from 14.7% in the previous
financial year to 10.7% in the financial
year 2009. The decrease was mainly
attributable to the decline in gross
profit and gross margin together
with the steep depreciation of the
Euro and Sterling against the
US dollar.
Selling and distribution costs
decreased by 6.6% from US$248.5
million in the previous financial year
to US$232.1 million in the financial
year 2009. The decrease was mainly
attributable to the decreased spending
on advertising and promotional
activities of the Group. Royalty
payments to licensors for the use of
popular cartoon characters for certain
ELPs also decreased, which led the
decline in selling and distribution
costs in the financial year 2009. As a
percentage of Group revenue, selling
and distribution costs were 16.0% in
the financial year 2009, the same as
the previous financial year.
Administrative and other operating
expenses increased from US$54.3
million in the previous financial year
to US$84.2 million in the financial
year 2009. An exchange loss of
US$27.6 million arising from the
Group’s global operations in the
ordinary course of business was
recorded under administrative
and other operating expenses in
the financial year 2009 as the Euro
and Sterling weakened abruptly
against the US dollar. This contrasted
with an exchange gain of US$10.7
million recorded in the previous
financial year. Excluding the effect
of exchange differences, the
administrative and other operating
expenses decreased by US$8.4 million
compared to the previous financial
year. Administrative and other
operating expenses as a percentage
of Group revenue, excluding the
effect of exchange differences,
improved from 4.2% in the previous
financial year to 3.9% in the financial
year 2009.
Research and development activities
are vital for the long-term development
of the Group. During the financial
year 2009, the research and
development expense was US$56.9
million, an increase of 10.9% over the
previous financial year. Research
and development expenses as a
percentage of Group revenue increased
from 3.3% in the previous financial
year to 3.9% in financial year 2009.
NET PROFIT AND DIVIDENDS
The profit attributable to shareholders
for the year ended 31st March 2009
was US$143.2 million, a decrease of
US$72.5 million as compared to the
previous financial year. The ratios of
EBIT and EBITDA to revenue were
10.7% and 12.9% respectively.
51.3
45.2
40.3
38.5
56.9
05 06 07 08 09 05 06 07 08 09 05 06 07 08 09