Vtech 2009 Annual Report Download - page 11
Download and view the complete annual report
Please find page 11 of the 2009 Vtech annual report below. You can navigate through the pages in the report by either clicking on the pages listed below, or by using the keyword search tool below to find specific information within the annual report.-
 1
1 -
 2
2 -
 3
3 -
 4
4 -
 5
5 -
 6
6 -
 7
7 -
 8
8 -
 9
9 -
 10
10 -
 11
11 -
 12
12 -
 13
13 -
 14
14 -
 15
15 -
 16
16 -
 17
17 -
 18
18 -
 19
19 -
 20
20 -
 21
21 -
 22
22 -
23
-
24
-
25
-
26
-
27
-
28
-
29
-
30
-
31
-
32
-
33
-
34
-
35
-
36
-
37
-
38
-
39
-
40
-
41
-
42
-
43
-
44
-
45
-
46
-
47
-
48
-
49
-
50
-
51
-
52
-
53
-
54
-
55
-
56
-
57
-
58
-
59
-
60
-
61
-
62
-
63
-
64
 |
 |

VTech Holdings Ltd Annual Report 2009 9
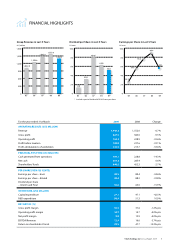
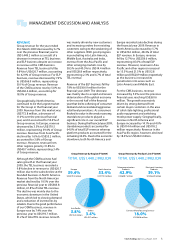
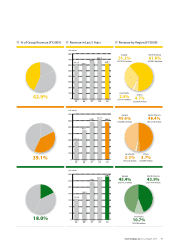
Revenue by Region (FY2009)% of Group Revenue (FY2009) Revenue in Last 5 Years
Asia Pacific
2.3%
US$14.4 million
Europe
31.2%
US$193.7 million
North America
61.8%
US$383.8 million
612.5
Others
4.7%
US$28.8 million
Asia Pacific
10.7%
US$28.0 million
Europe
45.4%
US$118.2 million
North America
43.9%
US$114.4 million
Asia Pacific
2.3%
US$12.8 million
Europe
45.6%
US$258.6 million
Others
3.7%
US$20.9 million
42.9%
39.1%
18.0%
594.7
660.6
688.0
620.7
128.4
158.2
233.1 248.3
260.6
North America
48.4%
US$274.6 million
800
700
600
500
400
300
200
100
0
700
600
500
400
300
200
100
0
280
240
200
160
120
80
40
0
US$ million
US$ million
US$ million
281.1
451.7
570.1 615.7 566.9
05 06 07 08 09
05 06 07 08 09
05 06 07 08 09