Vtech 2009 Annual Report Download - page 7
Download and view the complete annual report
Please find page 7 of the 2009 Vtech annual report below. You can navigate through the pages in the report by either clicking on the pages listed below, or by using the keyword search tool below to find specific information within the annual report.-
 1
1 -
 2
2 -
 3
3 -
 4
4 -
 5
5 -
 6
6 -
 7
7 -
 8
8 -
 9
9 -
 10
10 -
 11
11 -
 12
12 -
 13
13 -
 14
14 -
 15
15 -
 16
16 -
 17
17 -
 18
18 -
19
-
20
-
21
-
22
-
23
-
24
-
25
-
26
-
27
-
28
-
29
-
30
-
31
-
32
-
33
-
34
-
35
-
36
-
37
-
38
-
39
-
40
-
41
-
42
-
43
-
44
-
45
-
46
-
47
-
48
-
49
-
50
-
51
-
52
-
53
-
54
-
55
-
56
-
57
-
58
-
59
-
60
-
61
-
62
-
63
-
64
 |
 |

MANAGEMENT DISCUSSION AND ANALYSIS
VTech Holdings Ltd Annual Report 2009 5
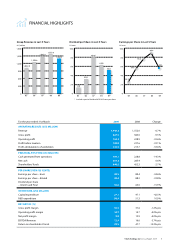
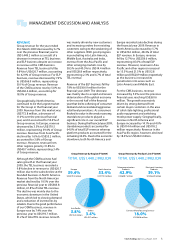
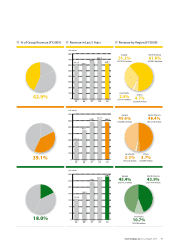
TOTAL US$1,448.2 MILLION
Asia Pacific
3.8%
US$55.2 million
Others
3.4%
US$49.7 million
Group Revenue by Region (FY2009)
TOTAL US$1,448.2 MILLION
Telecommunication
Products
42.9%
US$620.7 million
Contract Manufacturing Services
18.0%
US$260.6 million
Group Revenue by Product Line (FY2009)
Electronic Learning
Products
39.1%
US$566.9 million
Europe
39.4%
US$570.5 million
North America
53.4%
US$772.8 million
REVENUE
Group revenue for the year ended
31st March 2009 decreased by 6.7%
over the previous financial year to
US$1,448.2 million as a result of a
decrease in revenue at TEL business
and ELP business despite an increase
in revenue at the CMS business.
Revenue from TEL business fell by
9.8% to US$620.7 million, accounting
for 42.9% of Group revenue. For ELP
business, revenue decreased by 7.9%
to US$566.9 million, representing
39.1% of Group revenue. Revenue
of the CMS business rose by 5.0% to
US$260.6 million, accounting for
18.0% of Group revenue.
Geographically, North America
continued to be the largest market
for the Group in the financial year
2009. Revenue from this market was
US$772.8 million, a decrease of
11.0% over the previous financial
year, and it accounted for 53.4% of
Group revenue. In Europe, revenue
decreased by 3.3% to US$570.5
million, representing 39.4% of Group
revenue. Revenue from Asia Pacific
declined by 1.6% to US$55.2 million,
accounted for 3.8% of Group
revenue. However, revenue from
other regions grew by 31.8% to
US$49.7 million, representing 3.4%
of Group revenue.
Although the ODM business had
sales growth in the financial year
2009, the TEL business recorded a
9.8% decline in revenue to US$620.7
million due to the sales decline at the
branded business in North America.
Revenue from the North American
market declined by 19.5% over the
previous financial year to US$383.8
million, 61.8% of total TEL revenue.
The decline was mainly due to the
economic downturn in the United
States, which led to slowing demand
and a reduction of inventories by
retailers. Due to the good performance
of our ODM business, revenue in
Europe rose by 7.4% over the
previous year to US$193.7 million,
31.2% of total TEL revenue. Growth
was mainly driven by new customers
and increasing orders from existing
customers owing to the weakening of
other suppliers. With good progress
in penetrating into Latin America,
Middle East, Australia and India,
revenue from the Asia Pacific and
other emerging markets rose by
38.5% and 40.5% to US$14.4 million
and US$28.8 million respectively,
representing 2.3% and 4.7% of total
TEL revenue.
Revenue of the ELP business fell by
7.9% to US$566.9 million for the
financial year 2009. The decrease
was mainly due to a rapid and severe
deterioration of the global economy
in the second half of the financial
year that led to softening of consumer
demand and necessitated aggressive
retail level promotions. As consumers
flocked to value in the weak economy,
standalone products played a
significant role in our overall ELP
business. During the financial year 2009,
standalone products accounted for
64.0% of total ELP revenue whereas
platform products accounted for the
remaining 36.0%. Due to the economic
slowdown, both North America and
Europe recorded sales declines during
the financial year 2009. Revenue in
North America decreased by 5.7%
to US$274.6 million, 48.4% of total
ELP revenue. In Europe, revenue
fell by 12.7% to US$258.6 million,
representing 45.6% of total ELP
revenue. However, revenue in Asia
Pacific and other regions increased
by 13.3% and 21.5% to US$12.8
million and US$20.9 million respectively
as the business increased its
penetration into areas such as
Latin America and Middle East.
For the CMS business, revenue
increased by 5.0% over the previous
financial year, reaching US$260.6
million. The growth was mainly
driven by strong demand from
certain major customers in the area
of solid-state lighting, professional
audio equipment and switching
mode power supply. Geographically,
revenue in North America and
Europe increased by 14.1% and 4.0%
to US$114.4 million and US$118.2
million respectively. Revenue in the
Asia Pacific region, however, declined
by 18.6% to US$28.0 million.