Vonage 2011 Annual Report Download - page 33
Download and view the complete annual report
Please find page 33 of the 2011 Vonage annual report below. You can navigate through the pages in the report by either clicking on the pages listed below, or by using the keyword search tool below to find specific information within the annual report.-
 1
1 -
2
-
3
-
4
-
5
-
6
-
7
-
8
-
9
-
10
-
11
-
12
-
13
-
14
-
15
-
16
-
17
-
18
-
19
-
20
-
21
-
22
-
 23
23 -
 24
24 -
 25
25 -
 26
26 -
 27
27 -
 28
28 -
 29
29 -
 30
30 -
 31
31 -
 32
32 -
 33
33 -
 34
34 -
 35
35 -
 36
36 -
 37
37 -
 38
38 -
 39
39 -
 40
40 -
 41
41 -
 42
42 -
 43
43 -
44
-
45
-
46
-
47
-
48
-
49
-
50
-
51
-
52
-
53
-
54
-
55
-
56
-
57
-
58
-
59
-
60
-
61
-
62
-
63
-
64
-
65
-
66
-
67
-
68
-
69
-
70
-
71
-
72
-
73
-
74
-
75
-
76
-
77
-
78
-
79
-
80
-
81
-
82
-
83
-
84
-
85
-
86
-
87
-
88
-
89
-
90
-
91
-
92
-
93
-
94
 |
 |

Trends in Our Industry and Key Operating Data A num-
ber of trends in our industry have a significant effect on our
results of operations and are important to an understanding of
our financial statements.
Competitive landscape. We face intense competition from
traditional telephone companies, wireless companies, cable
companies, and alternative voice communication providers. Most
traditional wireline and wireless telephone service providers and
cable companies are substantially larger and better capitalized
than we are and have the advantage of a large existing customer
base. In addition, because our competitors provide other serv-
ices, they often choose to offer VoIP services or other voice serv-
ices as part of a bundle that includes other products, such as
video, high speed Internet access, and wireless telephone serv-
ice, which we do not offer. Further, as wireless providers offer
more minutes at lower prices, better coverage, and companion
landline alternative services, their services have become more
attractive to households as a replacement for wireline service.
We also compete against alternative voice communication pro-
viders, such as magicJack, Skype, and Google Voice. Some of
these service providers have chosen to sacrifice telephony rev-
enue in order to gain market share and have offered their serv-
ices at low prices or for free. As we continue to introduce
applications that integrate different forms of voice and messaging
services over multiple devices, we are facing competition from
emerging competitors focused on similar integration, as well as
from alternative voice communication providers. In addition, our
competitors have partnered and may in the future partner with
other competitors to offer products and services, leveraging their
collective competitive positions. We also are subject to the risk of
future disruptive technologies. In connection with our increasing
emphasis on the international long distance market, we face
competition from low-cost international calling cards and VoIP
providers in addition to traditional telephone companies, cable
companies, and wireless companies.
Broadband adoption. The number of United States house-
holds with broadband Internet access has grown significantly. On
March 16, 2010, the Federal Communications Commission
(“FCC”) released its National Broadband Plan, which seeks,
through supporting broadband deployment and programs, to
encourage broadband adoption for the approximately 100 million
United States residents who do not have broadband at home.
We expect the trend of greater broadband adoption to continue.
We benefit from this trend because our service requires a broad-
band Internet connection and our potential addressable market
increases as broadband adoption increases.
Regulation. Our business has developed in a relatively lightly
regulated environment. The United States and other countries,
however, are examining how VoIP services should be regulated.
The November 2010 order by the FCC in response to a request
by Kansas and Nebraska that permits states to impose state
universal service fund obligations on VoIP service, discussed in
Note 10 to our financial statements, is an example of efforts by
regulators to determine how VoIP service fits into the tele-
communications regulatory landscape. In addition to regulatory
matters that directly address VoIP, a number of other regulatory
initiatives could impact our business. One such regulatory ini-
tiative is net neutrality. In December 2010, the FCC adopted a
revised set of net neutrality rules for broadband Internet service
providers. These rules make it more difficult for broadband Inter-
net service providers to block or discriminate against Vonage
service. Several broadband Internet service providers have filed
appeals of the FCC’s new rules at the D.C. Circuit Court of
Appeals alleging that the FCC lacks authority to apply its rules to
broadband Internet service providers. In addition, on February 9,
2011, the FCC released a Notice of Proposed Rulemaking on
reforming universal service and the intercarrier compensation
(“ICC”) system that governs payments between tele-
communications carriers primarily for terminating traffic. The
FCC's adoption of an ICC proposal will impact Vonage's costs
for telecommunications services. On October 27, 2011, the FCC
adopted an order reforming universal service and ICC. The FCC
order provides that VoIP originated calls will be subject to inter-
state access charges for long distance calls and reciprocal
compensation for local calls that terminate to the public switched
telephone network (“PSTN”). The termination charges for all traf-
fic, including VoIP originated traffic, will transition over several
years to a bill and keep arrangement (i.e., no termination
charges). We believe that the order would positively impact our
costs over time. See also the discussion under “Regulation” in
Note 10 to our financial statements for a discussion of certain
other regulatory issues that impact us.
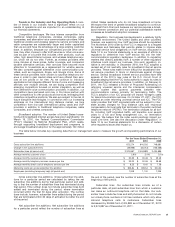
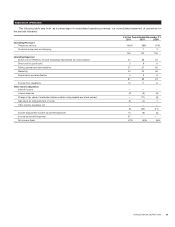
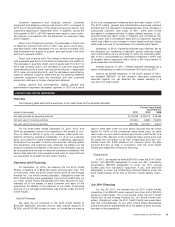
The table below includes key operating data that our management uses to measure the growth and operating performance of our
business:
For the Years Ended December 31,
2011 2010 2009
Gross subscriber line additions 672,274 640,205 748,681
Change in net subscriber lines (29,996) (30,013) (155,458)
Subscriber lines (at period end) 2,374,887 2,404,883 2,434,896
Average monthly customer churn 2.6% 2.4% 3.1%
Average monthly revenue per line $ 30.35 $ 30.48 $ 29.49
Average monthly telephony services revenue per line $ 30.22 $ 30.06 $ 28.68
Average monthly direct cost of telephony services per line $ 8.23 $ 8.40 $ 7.08
Marketing costs per gross subscriber line addition $ 303.84 $ 309.54 $ 304.52
Employees (excluding temporary help) (at period end) 1,008 1,140 1,225
Gross subscriber line additions. Gross subscriber line addi-
tions for a particular period are calculated by taking the net
subscriber line additions during that particular period and add-
ing to that the number of subscriber lines that terminated during
that period. This number does not include subscriber lines both
added and terminated during the period, where termination
occurred within the first 30 days after activation. The number
does include, however, subscriber lines added during the period
that are terminated within 30 days of activation but after the end
of the period.
Net subscriber line additions. Net subscriber line additions
for a particular period reflect the number of subscriber lines at
the end of the period, less the number of subscriber lines at the
beginning of the period.
Subscriber lines. Our subscriber lines include, as of a
particular date, all paid subscriber lines from which a customer
can make an outbound telephone call on that date. Our sub-
scriber lines include fax lines and soft phones but do not include
our virtual phone numbers or toll free numbers, which only allow
inbound telephone calls to customers. Subscriber lines
decreased by 29,996 from 2,404,883 as of December 31, 2010
to 2,374,887 as of December 31, 2011.
VONAGE ANNUAL REPORT 2011 25