Vodafone 2007 Annual Report Download - page 129
Download and view the complete annual report
Please find page 129 of the 2007 Vodafone annual report below. You can navigate through the pages in the report by either clicking on the pages listed below, or by using the keyword search tool below to find specific information within the annual report.-
 1
1 -
2
-
3
-
4
-
5
-
6
-
7
-
8
-
9
-
10
-
11
-
12
-
13
-
14
-
15
-
16
-
17
-
18
-
19
-
20
-
21
-
22
-
23
-
24
-
25
-
26
-
27
-
28
-
29
-
30
-
31
-
32
-
33
-
34
-
35
-
36
-
37
-
38
-
39
-
40
-
41
-
42
-
43
-
44
-
45
-
46
-
47
-
48
-
49
-
50
-
51
-
52
-
53
-
54
-
55
-
56
-
57
-
58
-
59
-
60
-
61
-
62
-
63
-
64
-
65
-
66
-
67
-
68
-
69
-
70
-
71
-
72
-
73
-
74
-
75
-
76
-
77
-
78
-
79
-
80
-
81
-
82
-
83
-
84
-
85
-
86
-
87
-
88
-
89
-
90
-
91
-
92
-
93
-
94
-
95
-
96
-
97
-
98
-
99
-
100
-
101
-
102
-
103
-
104
-
105
-
106
-
107
-
108
-
109
-
110
-
111
-
112
-
113
-
114
-
115
-
116
-
117
-
118
-
 119
119 -
 120
120 -
 121
121 -
 122
122 -
 123
123 -
 124
124 -
 125
125 -
 126
126 -
 127
127 -
 128
128 -
 129
129 -
 130
130 -
 131
131 -
 132
132 -
 133
133 -
 134
134 -
 135
135 -
 136
136 -
 137
137 -
 138
138 -
 139
139 -
140
-
141
-
142
-
143
-
144
-
145
-
146
-
147
-
148
-
149
-
150
-
151
-
152
-
153
-
154
-
155
-
156
-
157
-
158
-
159
-
160
-
161
-
162
-
163
-
164
 |
 |

Vodafone Group Plc Annual Report 2007 127
Financials
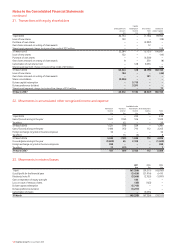
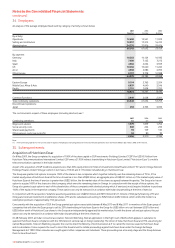
Defined benefit schemes
The most recent full formal actuarial valuations for defined benefit schemes have been updated by qualified independent actuaries for the financial year
ended 31 March 2007 to provide the IAS 19 disclosures below.
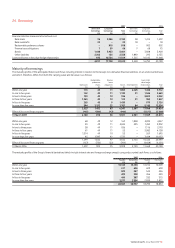
Major assumptions used
2007(1) 2006(1) 2005(1)
%%%
Weighted average actuarial assumptions used to determine benefit obligations:
Rate of inflation 2.7% 2.5% 2.5%
Rate of increase in salaries 4.4% 4.2% 4.1%
Rate of increase in pensions in payment and deferred pensions 2.7% 2.5% 2.5%
Discount rate 5.1% 4.8% 5.1%
Weighted average actuarial assumptions used to determine net periodic benefit cost:
Rate of inflation 2.5% 2.5% 2.3%
Rate of increase in salaries 4.2% 4.1% 3.9%
Discount rate 4.8% 5.1% 5.3%
Expected long term rate of return on plan assets during the year 6.5% 6.4% 6.5%
Expected rates of return:
Equities 7.8% 7.3% 7.5%
Bonds(2) 4.8% 4.2% 4.4%
Other assets 5.3% 3.4% 4.5%
Notes:
(1) Figures shown represent a weighted average assumption of the individual schemes.
(2) For the year ending 31 March 2007 the expected rate of return for bonds consisted of a 5.1 per cent rate of return for corporate bonds and a 4.0 per cent rate of return for government bonds.
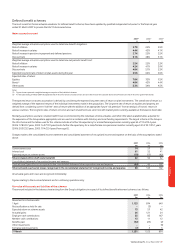
The expected return on assets assumption is derived by considering the expected long term rates of return on plan investments. The overall rate of return is a
weighted average of the expected returns of the individual investments made in the group plans. The long term rate of return on equities and property are
derived from considering current “risk free” rates of return with the addition of an appropriate future “risk premium” from an analysis of historic returns in
various countries. The long term rates of return on bonds and cash investments are set in line with market yields currently available at the balance sheet date.
Mortality assumptions used are consistent with those recommended by the individual scheme actuaries, and reflect the latest available tables, adjusted for
the experience of the Group where appropriate, and are used in accordance with statutory and local funding requirements. The largest scheme in the Group is
the UK scheme and the tables used for this scheme indicate a further life expectancy for a male/female pensioner currently aged 65 of 19.4/22.4 years
(2006: 17.8/20.7 years, 2005: 16.9/19.9 years) and a further life expectancy for a male/female non-pensioner member currently aged 40 of 22.1/25.1 years
(2006: 20.3/23.3 years, 2005: 19.4/22.4 years) from age 65.
Charges made to the consolidated income statement and consolidated statement of recognised income and expense on the basis of the assumptions stated
above:
2007 2006 2005
£m £m £m
Current service cost 74 57 53
Interest cost 61 52 41
Expected return on scheme assets (73) (57) (42)
Total included within staff costs (note 34) 62 52 52
Consolidated statement of recognised income and expense:
Total actuarial (gains)/losses recognised in the consolidated statement of recognised income and expense (65) 43 102
Total cumulative actuarial losses recognised in the consolidated statement of recognised income and expense 80 145 102
All actuarial gains and losses are recognised immediately.
Figures relating to the income statement are for continuing operations only.
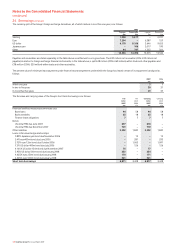
Fair value of the assets and liabilities of the schemes
The amount included in the balance sheet arising from the Group’s obligations in respect of its defined benefit retirement schemes is as follows:
2007 2006 2005
£m £m £m
Movement in scheme assets:
1 April 1,123 874 640
Reclassification as held for sale –(3) –
Expected return on scheme assets 73 57 42
Actuarial gains 26 121 24
Employer cash contributions 55 85 167
Member cash contributions 13 11 12
Benefits paid (32) (27) (7)
Other movements – – (9)
Exchange rate movements (7) 55
31 March 1,251 1,123 874