Vodafone 2007 Annual Report Download - page 103
Download and view the complete annual report
Please find page 103 of the 2007 Vodafone annual report below. You can navigate through the pages in the report by either clicking on the pages listed below, or by using the keyword search tool below to find specific information within the annual report.-
 1
1 -
2
-
3
-
4
-
5
-
6
-
7
-
8
-
9
-
10
-
11
-
12
-
13
-
14
-
15
-
16
-
17
-
18
-
19
-
20
-
21
-
22
-
23
-
24
-
25
-
26
-
27
-
28
-
29
-
30
-
31
-
32
-
33
-
34
-
35
-
36
-
37
-
38
-
39
-
40
-
41
-
42
-
43
-
44
-
45
-
46
-
47
-
48
-
49
-
50
-
51
-
52
-
53
-
54
-
55
-
56
-
57
-
58
-
59
-
60
-
61
-
62
-
63
-
64
-
65
-
66
-
67
-
68
-
69
-
70
-
71
-
72
-
73
-
74
-
75
-
76
-
77
-
78
-
79
-
80
-
81
-
82
-
83
-
84
-
85
-
86
-
87
-
88
-
89
-
90
-
91
-
92
-
 93
93 -
 94
94 -
 95
95 -
 96
96 -
 97
97 -
 98
98 -
 99
99 -
 100
100 -
 101
101 -
 102
102 -
 103
103 -
 104
104 -
 105
105 -
 106
106 -
 107
107 -
 108
108 -
 109
109 -
 110
110 -
 111
111 -
 112
112 -
 113
113 -
114
-
115
-
116
-
117
-
118
-
119
-
120
-
121
-
122
-
123
-
124
-
125
-
126
-
127
-
128
-
129
-
130
-
131
-
132
-
133
-
134
-
135
-
136
-
137
-
138
-
139
-
140
-
141
-
142
-
143
-
144
-
145
-
146
-
147
-
148
-
149
-
150
-
151
-
152
-
153
-
154
-
155
-
156
-
157
-
158
-
159
-
160
-
161
-
162
-
163
-
164
 |
 |

Vodafone Group Plc Annual Report 2007 101
Financials
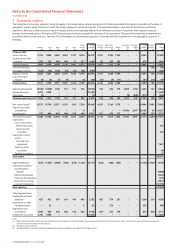
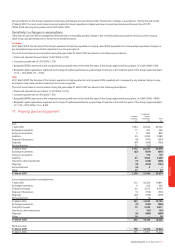
Other Total Eastern Middle East, Associates Associates Total Common
Germany Italy Spain UK Arcor(1) Europe – Europe Europe Africa & Asia Pacific – US – Other – EMAPA Functions Group
£m £m £m £m £m £m £m £m £m £m £m £m £m £m £m
31 March 2006
Service revenue 5,394 4,170 3,615 4,568 1,305 4,349 23,401 1,358 1,625 1,212 – – 4,195 – 27,596
Equipment and other
revenue 360 193 380 480 15 348 1,776 77 159 123 – – 359 – 2,135
Segment revenue 5,754 4,363 3,995 5,048 1,320 4,697 25,177 1,435 1,784 1,335 – – 4,554 – 29,731
Common functions 145 145
Intra-region revenue (143) (39) (100) (50) (34) (78) (444) – – – – – – – (444)
Regional revenue 5,611 4,324 3,895 4,998 1,286 4,619 24,733 1,435 1,784 1,335 – – 4,554 145 29,432
Less: Inter-region revenue (9) (4) (2) (10) – (3) (28) (14) (15) (14) – – (43) (11) (82)
Group revenue 5,602 4,320 3,893 4,988 1,286 4,616 24,705 1,421 1,769 1,321 – – 4,511 134 29,350
Operating (loss)/profit (17,904) (1,928) 968 698 139 466 (17,561) 176 523 140 1,732 683 3,254 223 (14,084)
Impairment losses 19,400 3,600 – – – 515 23,515 – – – – – – – 23,515
Other items – – – – – (3) (3) – – – – (17) (17) (12) (32)
Adjusted operating profit 1,496 1,672 968 698 139 978 5,951 176 523 140 1,732 666 3,237 211 9,399
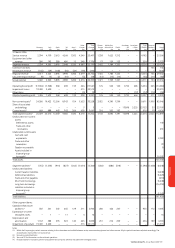
Non-current assets(2) 24,360 19,422 12,596 8,743 754 7,653 73,528 3,922 4,390 1,299 – – 9,611 1,907 85,046
Share of associated
undertakings – – – – – 7 7 – – – 17,898 5,255 23,153 37 23,197
Current assets(2) 669 888 443 743 266 658 3,667 216 502 192 – – 910 79 4,656
Total segment assets(2) 25,029 20,310 13,039 9,486 1,020 8,318 77,202 4,138 4,892 1,491 17,898 5,255 33,674 2,023 112,899
Unallocated non-current
assets:
Deferred tax assets 140
Trade and other
receivables 231
Unallocated current assets:
Cash and cash
equivalents 2,789
Trade and other
receivables 79
Taxation recoverable 8
Assets included in
disposal group
for resale(3) 10,592
Total assets 126,738
Segment liabilities(2) (753) (1,370) (914) (827) (362) (1,074) (5,300) (392) (880) (318) – – (1,590) (1,458) (8,348)
Unallocated liabilities:
Current taxation liabilities (4,448)
Deferred tax liabilities (5,670)
Trade and other payables (219)
Short term borrowings (3,448)
Long term borrowings (16,750)
Liabilities included in
disposal group
for resale(3) (2,543)
Total liabilities (41,426)
Other segment items:
Capitalised fixed asset
additions(4) 592 541 502 665 129 511 2,940 280 426 247 – – 953 112 4,005
Expenditure on other
intangible assets – 1 – 11 – 4 16 – – – – – – – 16
Depreciation and
amortisation 1,167 588 395 924 140 645 3,859 231 216 209 – – 656 189 4,704
Impairment of goodwill 19,400 3,600 – – – 515 23,515 – – – – – – – 23,515
Notes:
(1) Within the Europe region, certain revenues relating to Arcor have been reclassified between service revenue and equipment and other revenue. All prior periods have been adjusted accordingly. The
reclassification had no effect on total revenue.
(2) Excluding unallocated items.
(3) See note 29 for information on discontinued operations.
(4) Includes additions to property, plant and equipment and computer software, included within intangible assets.