United Healthcare 2003 Annual Report Download - page 59
Download and view the complete annual report
Please find page 59 of the 2003 United Healthcare annual report below. You can navigate through the pages in the report by either clicking on the pages listed below, or by using the keyword search tool below to find specific information within the annual report.-
 1
1 -
2
-
3
-
4
-
5
-
6
-
7
-
8
-
9
-
10
-
11
-
12
-
13
-
14
-
15
-
16
-
17
-
18
-
19
-
20
-
21
-
22
-
23
-
24
-
25
-
26
-
27
-
28
-
29
-
30
-
31
-
32
-
33
-
34
-
35
-
36
-
37
-
38
-
39
-
40
-
41
-
42
-
43
-
44
-
45
-
46
-
47
-
48
-
 49
49 -
 50
50 -
 51
51 -
 52
52 -
 53
53 -
 54
54 -
 55
55 -
 56
56 -
 57
57 -
 58
58 -
 59
59 -
 60
60 -
 61
61 -
 62
62 -
 63
63 -
 64
64 -
 65
65 -
 66
66 -
 67
67 -
 68
68 -
 69
69 -
70
-
71
-
72
 |
 |

UnitedHealth Group 57
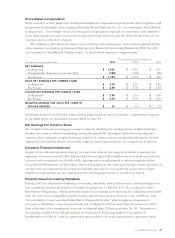
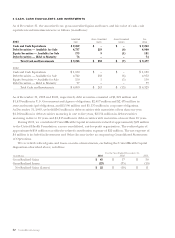
10 STOCK-BASED COMPENSATION PLANS
As of December 31, 2003, we had approximately 42 million shares available for future grants of stock-based
awards under our stock-based compensation plan including, but not limited to, incentive or non-qualified
stock options, stock appreciation rights and restricted stock.
Stock options are granted at an exercise price not less than the fair value of our common stock on the
date of grant. They generally vest ratably over four years and may be exercised up to 10 years from the date
of grant. Activity under our stock option plan is summarized in the table below (shares in thousands):
2003
2002 2001
Weighted-Average Weighted-Average Weighted-Average
Shares Exercise Price Shares Exercise Price Shares Exercise Price
Outstanding at Beginning of Year
86,402 $ 21
76,674 $15 77,621 $11
Granted
18,426 $ 44
25,033 $38 16,277 $27
Assumed in Acquisitions
– $ –
914 $30 388 $10
Exercised
(15,340) $ 15
(13,227) $14 (15,432) $10
Forfeited
(2,182) $ 30
(2,992) $20 (2,180) $13
Outstanding at End of Year
87,306 $ 27
86,402 $21 76,674 $15
Exercisable at End of Year
42,693 $ 16
41,391 $12 39,170 $11
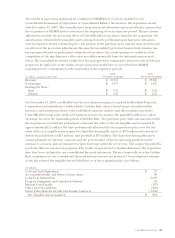
As of December 31, 2003
Options Outstanding Options Exercisable
Weighted-Average
Number Remaining Weighted-Average Number Weighted-Average
Range of Exercise Prices Outstanding Option Term (years) Exercise Price Exercisable Exercise Price
$0 - $10 18,395 5.4 $10 18,228 $10
$11 - $20 17,063 4.9 $14 14,442 $13
$21 - $35 23,670 7.5 $30 7,318 $29
$36 - $55 28,178 9.1 $43 2,705 $42
$0 - $55 87,306 7.1 $27 42,693 $16
To determine compensation expense under the fair value method, the fair value of each option grant
is estimated on the date of grant using an option-pricing model. During 2001 and 2002 we utilized a
Black-Scholes model for purposes of estimating the fair value of our employee stock option grants.
During 2003, we began using a binomial model that considers certain factors that the Black-Scholes
model does not, such as historical exercise patterns and the illiquid nature of employee options. For
these reasons, we believe that the binomial model provides a more representative employee stock option
fair value. The principal assumptions we used in applying the option pricing models were as follows:
2003 2002 2001
Risk-Free Interest Rate 2.6% 2.5% 3.7%
Expected Volatility 30.9% 40.2% 45.9%
Expected Dividend Yield 0.1% 0.1% 0.1%
Expected Life in Years 4.1 4.5 4.8
Information regarding the effect on net earnings and net earnings per common share had we applied the
fair value expense recognition provisions of FAS No. 123 is included in Note 2. We also maintain a 401(k)
plan and an employee stock purchase plan. Activity related to these plans was not significant in relation to
our consolidated financial results in 2003, 2002 and 2001.