Unilever 2004 Annual Report Download - page 10
Download and view the complete annual report
Please find page 10 of the 2004 Unilever annual report below. You can navigate through the pages in the report by either clicking on the pages listed below, or by using the keyword search tool below to find specific information within the annual report.-
 1
1 -
 2
2 -
 3
3 -
 4
4 -
 5
5 -
 6
6 -
 7
7 -
 8
8 -
 9
9 -
 10
10 -
 11
11 -
 12
12 -
 13
13 -
 14
14 -
 15
15 -
 16
16 -
 17
17 -
 18
18 -
 19
19 -
 20
20 -
 21
21 -
22
-
23
-
24
-
25
-
26
-
27
-
28
-
29
-
30
-
31
-
32
-
33
-
34
-
35
-
36
-
37
-
38
-
39
-
40
-
41
-
42
-
43
-
44
-
45
-
46
-
47
-
48
-
49
-
50
-
51
-
52
-
53
-
54
-
55
-
56
-
57
-
58
-
59
-
60
-
61
-
62
-
63
-
64
-
65
-
66
-
67
-
68
-
69
-
70
-
71
-
72
-
73
-
74
-
75
-
76
-
77
-
78
-
79
-
80
-
81
-
82
-
83
-
84
-
85
-
86
-
87
-
88
-
89
-
90
-
91
-
92
-
93
-
94
-
95
-
96
-
97
-
98
-
99
-
100
-
101
-
102
-
103
-
104
-
105
-
106
-
107
-
108
-
109
-
110
-
111
-
112
-
113
-
114
-
115
-
116
-
117
-
118
-
119
-
120
-
121
-
122
-
123
-
124
-
125
-
126
-
127
-
128
-
129
-
130
-
131
-
132
-
133
-
134
-
135
-
136
-
137
-
138
-
139
-
140
-
141
-
142
-
143
-
144
-
145
-
146
-
147
-
148
-
149
-
150
-
151
-
152
-
153
-
154
-
155
-
156
-
157
-
158
-
159
-
160
-
161
-
162
-
163
-
164
-
165
-
166
-
167
-
168
-
169
-
170
-
171
-
172
-
173
-
174
-
175
-
176
-
177
-
178
-
179
-
180
-
181
-
182
-
183
-
184
-
185
-
186
-
187
-
188
-
189
-
190
-
191
-
192
 |
 |

Unilever Annual Report and Accounts 2004 07
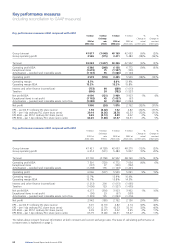
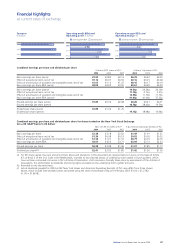
Financial highlights
at current rates of exchange
Combined earnings per share and dividends per share
Ordinary €0.51 shares of NV(a) Ordinary 1.4p shares of PLC
2004 2003 2002 2004 2003 2002
Basic earnings per share (euros) €1.92 €2.82 €2.14 €0.29 €0.42 €0.32
Effect of exceptional items net of tax €1.10 €0.07 €0.56 €0.16 €0.01 €0.08
Effect of amortisation of goodwill and intangible assets net of tax €1.07 €1.13 €1.25 €0.16 €0.17 €0.19
Basic earnings per share BEIA (euros) €4.09 €4.02 €3.95 €0.61 €0.60 €0.59
Basic earnings per share (pence) 19.51p 29.26p 20.19p
Effect of exceptional items net of tax 11.15p 0.73p 5.31p
Effect of amortisation of goodwill and intangible assets net of tax 10.95p 11.70p 11.72p
Basic earnings per share BEIA (pence) 41.61p 41.69p 37.22p
Diluted earnings per share (euros) €1.85 €2.74 €2.08 €0.28 €0.41 €0.31
Diluted earnings per share (pence) 18.78p 28.40p 19.59p
Dividend per share (euros) €1.89 €1.74 €1.70
Dividend per share (pence) 19.15p 18.08p 16.04p
Combined earnings per share and dividends per share for shares traded on the New York Stock Exchange
(on a UK GAAP basis) in US dollars
New York €0.51 shares of NV(a) 5.6p American Depositary Receipts of PLC
2004 2003 2002 2004 2003 2002
Basic earnings per share $2.38 $3.18 $2.02 $1.43 $1.91 $1.21
Effect of exceptional items net of tax $1.36 $0.08 $0.53 $0.82 $0.05 $0.32
Effect of amortisation of goodwill and intangible assets net of tax $1.33 $1.27 $1.16 $0.79 $0.76 $0.70
Basic earnings per share BEIA $5.07 $4.53 $3.71 $3.04 $2.72 $2.23
Diluted earnings per share $2.29 $3.08 $1.96 $1.37 $1.85 $1.17
Dividend per share(b)(c) $2.41 $2.05 $1.85 $1.42 $1.26 $1.02
(a) For NV share capital, the euro amounts shown above and elsewhere in this document are representations in euros on the basis of Article
67c of Book 2 of the Civil Code in the Netherlands, rounded to two decimal places, of underlying share capital in Dutch guilders, which
have not been converted into euros in NV’s Articles of Association. Until conversion formally takes place by amendment of the Articles of
Association, the entitlements to dividends and voting rights are based on the underlying Dutch guilder amounts.
(b) Rounded to two decimal places.
(c) Actual dividends payable for 2004 on NV New York shares and American Depositary Receipts of PLC may differ from those shown
above, which include final dividend values calculated using the rates of exchange ruling on 9 February 2005 (€1.00 = $1.2762,
£1.00 = $1.8618).
Operating profit BEIA Operating profit Operating margin BEIA Operating margin
Turnover
€ million
2004 40 366 6 138
3 455
6 772
5 529
7 054
5 091
2003 42 942
48 760
2002
Operating profit BEIA and
Operating profit € million
2004
2003
2002
15.2
8.6
15.8
12.9
14.5
10.4
2004
2003
2002
Operating margin BEIA and
Operating margin %