Unilever 1999 Annual Report Download - page 13
Download and view the complete annual report
Please find page 13 of the 1999 Unilever annual report below. You can navigate through the pages in the report by either clicking on the pages listed below, or by using the keyword search tool below to find specific information within the annual report.-
 1
1 -
2
-
 3
3 -
 4
4 -
 5
5 -
 6
6 -
 7
7 -
 8
8 -
 9
9 -
 10
10 -
 11
11 -
 12
12 -
 13
13 -
 14
14 -
 15
15 -
 16
16 -
 17
17 -
 18
18 -
 19
19 -
 20
20 -
 21
21 -
 22
22 -
 23
23 -
24
-
25
-
26
-
27
-
28
-
29
-
30
-
31
-
32
-
33
-
34
-
35
-
36
-
37
-
38
-
39
-
40
-
41
-
42
-
43
-
44
-
45
-
46
-
47
-
48
-
49
-
50
-
51
-
52
-
53
-
54
-
55
-
56
 |
 |

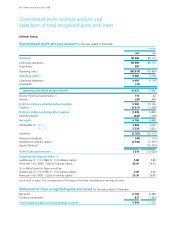
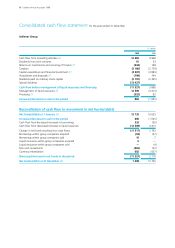
Unilever Group Notes to the consolidated accounts
1 Segmental information (continued)
Fl. million
1999 1998
Net operating assets
(c)
By geographical area:
Europe 7 572 7 187
North America 4 399 3 831
Africa and Middle East 1 794 1 542
Asia and Pacific 3 304 2 825
Latin America 3 350 3 019
20 419 18 404
By operation:
Foods – Oil & dairy based foods and bakery 2 786 2 854
– Ice cream and beverages 5 516 4 935
– Culinary and frozen foods 3 414 2 991
Home Care and Professional Cleaning 4 715 4 046
Personal Care 3 641 3 213
Other Operations 347 365
20 419 18 404
2 Operating costs
Cost of sales (49 010) (49 167)
Continuing operations (48 806) (49 167)
Acquisitions (204)
Distribution and selling costs (22 312) (21 752)
Continuing operations (22 250) (21 752)
Acquisitions (62)
Administrative expenses (9 492) (8 475)
Continuing operations (9 445) (8 475)
Acquisitions (47)
(80 814) (79 394)
Operating costs include:
Staff costs 3(12 842) (13 370)
Raw materials and packaging (38 634) (39 008)
Amortisation of goodwill and intangibles (50) (17)
Depreciation of tangible fixed assets (2 479) (2 051)
Advertising and promotions (11 779) (11 432)
Research and development (2 060) (1 828)
Lease rentals: Plant and machinery (241) (280)
Other (819) (678)
Remuneration of auditors:
Audit fees (27) (23)
Payments to PricewaterhouseCoopers
for non-audit services
(a)
(77) (66)
(a) Non-audit services include due diligence work in respect of
acquisitions and disposals Fl. 7 million (1998: Fl. 7 million);
tax compliance and advisory services Fl. 30 million
(1998: Fl. 10 million) and other general consultancy
Fl. 40 million (1998: Fl. 49 million).
3 Staff costs and employees
Fl. million
1999 1998
Staff costs:
Remuneration of employees (10 794) (11 251)
Emoluments of directors as managers (24) (26)
Pension costs:
Defined benefit schemes:
Regular cost (651) (650)
Other (245) (245)
Amortisation of
surpluses/deficits 30 534 626
Defined contribution schemes (10) (35)
Post-retirement health benefits (129) (154)
Social security costs (1 523) (1 635)
Total staff costs (12 842) (13 370)
Details of the remuneration of directors which form part of these
accounts are given in the following sections of the Directors’
remuneration and interests report: ‘Directors’ pensions’ on
pages 33 and 34; ‘Directors’ emoluments’ on page 35; ‘Directors’
interests: share options’ on pages 36, 37 and 38 and ‘Advisory
Directors’ on page 40.
The average number of employees
during the year was, in thousands:
Europe 79 83
North America 22 23
Africa and Middle East 52 58
Asia and Pacific 72 73
Latin America 30 30
255 267
4 Exceptional items
Included in operating profit
Restructuring (512) (585)
Other including business disposals (82) 861
(594) 276
By geographical area:
Europe (213) 398
North America (278) 86
Africa and Middle East 32 (3)
Asia and Pacific (40) (115)
Latin America (95) (90)
(594) 276
By operation:
Foods – Oil & dairy based foods
and bakery (165) (154)
– Ice cream and beverages (111) (168)
– Culinary and frozen foods (263) (112)
Home Care and Professional Cleaning (76) (135)
Personal Care (81) (49)
Other Operations 102 894
(594) 276
These amounts are mainly included in administrative expenses.
13 Unilever Annual Accounts 1999