Unilever 1999 Annual Report Download - page 12
Download and view the complete annual report
Please find page 12 of the 1999 Unilever annual report below. You can navigate through the pages in the report by either clicking on the pages listed below, or by using the keyword search tool below to find specific information within the annual report.-
 1
1 -
 2
2 -
 3
3 -
 4
4 -
 5
5 -
 6
6 -
 7
7 -
 8
8 -
 9
9 -
 10
10 -
 11
11 -
 12
12 -
 13
13 -
 14
14 -
 15
15 -
 16
16 -
 17
17 -
 18
18 -
 19
19 -
 20
20 -
 21
21 -
 22
22 -
23
-
24
-
25
-
26
-
27
-
28
-
29
-
30
-
31
-
32
-
33
-
34
-
35
-
36
-
37
-
38
-
39
-
40
-
41
-
42
-
43
-
44
-
45
-
46
-
47
-
48
-
49
-
50
-
51
-
52
-
53
-
54
-
55
-
56
 |
 |

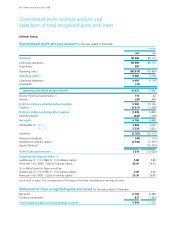
Notes to the consolidated accounts
Unilever Group
1 Segmental information
Fl. million 1999 1998
Continuing
operations Acquisitions Total Total
Turnover
(a)(b)
By geographical area:
Europe 41 308 96 41 404 41 805
North America 19 473 1 19 474 18 552
Africa and Middle East 5 065 — 5 065 4 911
Asia and Pacific 14 668 147 14 815 12 786
Latin America 9 482 56 9 538 11 058
89 996 300 90 296 89 112
By operation:
Foods – Oil & dairy based foods and bakery 16 038 — 16 038 16 952
– Ice cream and beverages 14 464 161 14 625 14 593
– Culinary and frozen foods 14 437 83 14 520 14 840
Home Care and Professional Cleaning 20 018 47 20 065 19 422
Personal Care 23 514 9 23 523 21 971
Other Operations 1 525 — 1 525 1 334
89 996 300 90 296 89 112
Operating profit
(a)
By geographical area before exceptional items:
Europe 4 980 8 4 988 4 670
North America 2 144 — 2 144 1 991
Africa and Middle East 553 — 553 493
Asia and Pacific 1 472 (17) 1 455 1 120
Latin America 940 (4) 936 1 168
Operating profit before exceptional items 10 089 (13) 10 076 9 442
Exceptional items 4
(d)
(594) — (594) 276
Operating profit 9 495 (13) 9 482 9 718
By operation before exceptional items:
Foods – Oil & dairy based foods and bakery 1 715 (1) 1 714 1 628
– Ice cream and beverages 1 327 (20) 1 307 1 312
– Culinary and frozen foods 1 449 11 1 460 1 464
Home Care and Professional Cleaning 1 883 (3) 1 880 1 983
Personal Care 3 479 — 3 479 2 812
Other Operations 236 — 236 243
Operating profit before exceptional items 10 089 (13) 10 076 9 442
Exceptional items 4
(d)
(594) — (594) 276
Operating profit 9 495 (13) 9 482 9 718
Notes:
(a) The analysis of turnover by geographical area is stated on the basis of origin. Turnover on a destination basis would not
be materially different. Inter-segment sales between operational segments and between geographical areas are not material. For
the United Kingdom and the Netherlands, the combined turnover was Fl. 10 996 million (1998: Fl. 10 846 million) and the
combined operating profit was Fl. 1 589 million (1998: Fl. 2 916 million).
(b) Group share of the turnover of joint ventures was Fl. 628 million (1998: Fl. 445 million) of which Fl. 200 million
(1998: Fl. 192 million) was in Europe. These figures are not included in the analysis above.
(c) Net operating assets are goodwill and intangible assets purchased after 1 January 1998, tangible fixed assets, stocks and debtors
less trade and other creditors (excluding taxation and dividends) and less provisions for liabilities and charges other than deferred
taxation and deferred purchase consideration. 1998 has been restated to include goodwill and intangible assets.
(d) 1998 included the profit on disposal of Plant Breeding International.
12 Unilever Annual Accounts 1999