Ubisoft 2001 Annual Report Download - page 69
Download and view the complete annual report
Please find page 69 of the 2001 Ubisoft annual report below. You can navigate through the pages in the report by either clicking on the pages listed below, or by using the keyword search tool below to find specific information within the annual report.-
 1
1 -
2
-
3
-
4
-
5
-
6
-
7
-
8
-
9
-
10
-
11
-
12
-
13
-
14
-
15
-
16
-
17
-
18
-
19
-
20
-
21
-
22
-
23
-
24
-
25
-
26
-
27
-
28
-
29
-
30
-
31
-
32
-
33
-
34
-
35
-
36
-
37
-
38
-
39
-
40
-
41
-
42
-
43
-
44
-
45
-
46
-
47
-
48
-
49
-
50
-
51
-
52
-
53
-
54
-
55
-
56
-
57
-
58
-
 59
59 -
 60
60 -
 61
61 -
 62
62 -
 63
63 -
 64
64 -
 65
65 -
 66
66 -
 67
67 -
 68
68 -
 69
69 -
 70
70 -
 71
71 -
 72
72 -
 73
73 -
 74
74 -
 75
75 -
 76
76 -
 77
77 -
 78
78 -
 79
79 -
80
-
81
-
82
-
83
-
84
-
85
-
86
-
87
-
88
-
89
-
90
-
91
-
92
-
93
-
94
-
95
-
96
-
97
-
98
-
99
-
100
-
101
-
102
-
103
-
104
-
105
-
106
-
107
-
108
-
109
-
110
-
111
-
112
-
113
-
114
-
115
-
116
-
117
-
118
-
119
-
120
-
121
-
122
-
123
-
124
 |
 |

FINANCIAL REPORT
Corporate accounts
69
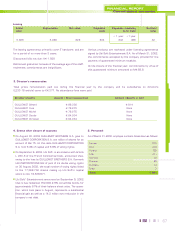
3.2.2 Income statement on March 31, 2002
en K
03.31.02 03.31.01 03.31.00
Production in financial year 226,134 161,470 126,250
Other operating income and costs transferred 8,887 6,458 4,429
Total operating income 235,021 167,928 130,679
Costs of sales 107,703 97,117 61,458
Changes in inventory 3,127 (8,640) (4,395)
Other purchases and external charges 86,499 51,221 36,562
Tax and duty 744 632 561
Wages and social security costs 393 87 326
Other costs 380 147 46
Depreciation and provisions 59,053 33,326 31,721
Total operating expenses 257,899 173,890 126,279
Earnings before interest and tax (22,878) (5,962) 4,400
Financial income from equity holdings 37 0 0
Income from other securities and claims on fixed assets 3,266 23 77
Other interest and related income (1) 3,188 2,951 1,184
Write-back of provisions 7,846 837 469
Unrealited exchange gains 322 18,693 7,234
Net proceeds from sales of transferable securities / 78 73
Total financial proceeds 14,659 22,582 9,037
Appropriations to provisions 7 ,075 2,943 1,352
Other interest and related expenses (2) 8,091 6,454 3,666
Unrealized exchange losses 4,630 15,593 4,927
Net interest disposal on war betable security 407 / /
Total financial expenses 20,203 24,990 9,945
Net financial income/expense (5,544) (2,408) (908)
Operating income less net financial income/expense (28,422) (8,370) 3,492
Exceptional income/expense 4,032 (39) (390)
Income before tax (24,390) (8,409) 3,102
Corporate tax ///
Net income for financial year (24,390) (8,409) 3,102
(1) including revenue from affiliated companies 3,105 2,534 1,024
(2) including expenses from affiliated companies 25 615 /