Ubisoft 2001 Annual Report Download - page 5
Download and view the complete annual report
Please find page 5 of the 2001 Ubisoft annual report below. You can navigate through the pages in the report by either clicking on the pages listed below, or by using the keyword search tool below to find specific information within the annual report.-
 1
1 -
 2
2 -
 3
3 -
 4
4 -
 5
5 -
 6
6 -
 7
7 -
 8
8 -
 9
9 -
 10
10 -
 11
11 -
 12
12 -
 13
13 -
 14
14 -
 15
15 -
 16
16 -
17
-
18
-
19
-
20
-
21
-
22
-
23
-
24
-
25
-
26
-
27
-
28
-
29
-
30
-
31
-
32
-
33
-
34
-
35
-
36
-
37
-
38
-
39
-
40
-
41
-
42
-
43
-
44
-
45
-
46
-
47
-
48
-
49
-
50
-
51
-
52
-
53
-
54
-
55
-
56
-
57
-
58
-
59
-
60
-
61
-
62
-
63
-
64
-
65
-
66
-
67
-
68
-
69
-
70
-
71
-
72
-
73
-
74
-
75
-
76
-
77
-
78
-
79
-
80
-
81
-
82
-
83
-
84
-
85
-
86
-
87
-
88
-
89
-
90
-
91
-
92
-
93
-
94
-
95
-
96
-
97
-
98
-
99
-
100
-
101
-
102
-
103
-
104
-
105
-
106
-
107
-
108
-
109
-
110
-
111
-
112
-
113
-
114
-
115
-
116
-
117
-
118
-
119
-
120
-
121
-
122
-
123
-
124
 |
 |

5
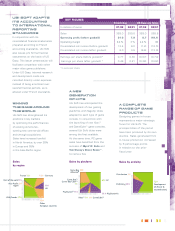
French Gap US Gaap pro forma
In millions of euros 01/02 00/01 01/02 00/01
Sales 369.0 259,8 369.0 259.8
Operating profit (before goodwill) 31.0 7,9 8,7 (19,1)
Operating margin 8.4 % 3 % 2.4 % NS
Consolidated net income (before goodwill) 13.4 6.0 (1.2) (12.5)
Consolidated net income (after goodwill) 8.0 3.6 (6.6) (13.9)
Earnings per share (before goodwill) * 0.77 0.30 (0.07) (0.74)
Earnings per share (after goodwill) * 0.46 0.21 (0.38) (0.82)
* In euros per share.
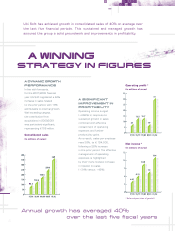
WWIINNNNIINNGG
TTHHEE GGAAMMEE AARROOUUNNDD
TTHHEE WWOORRLLDD
Ubi Soft has strengthened its
positions in key markets
by optimizing the performances
of existing structures,
opening new commercial offices
and through acquisitions.
Sales have increased twofold
in North America, by over 20%
in Europe and 55%
in the Asia-Pacific region.
Sales
by region
AA NNEEWW
GGEENNEERRAATTIIOONN
OOFF HHIITTSS
Ubi Soft has anticipated the
development of new gaming
platforms with flagship titles
adapted to each type of game
console. In conjunction with
the launching of new Xbox™
and GameCube™ game consoles,
several Ubi Soft titles were
among the first available.
At the same time, PC game
sales have benefited from the
success of Myst®III: Exile and
Tom Clancy's Ghost Recon™,
to name a few.
Sales by platform
AA CCOOMMPPLLEETTEE
RRAANNGGEE OOFF GGAAMMEE
PPRROODDUUCCTTSS
Designing games in-house
represents a major strategic
focus for Ubi Soft. The
principal titles of the period
have been produced by its own
studios. Sales generated from
in-house production increased
by 6 percentage points
in relation to the prior
fiscal year.
Sales by activity
UUBBII SSOOFFTT AADDAAPPTTSS
IITTSS AACCCCOOUUNNTTIINNGG
TTOO IINNTTEERRNNAATTIIOONNAALL
RREEPPOORRTTIINNGG
SSTTAANNDDAARRDDSS
In conjunction with its
consolidated financial statements
prepared according to French
accounting standards, Ubi Soft
also issues pro forma financial
statements on the basis of US
Gaap. This latter presentation will
facilitate comparison with other
major video game publishers.
Under US Gaap, internal research
and development costs are
recorded directly under expenses
instead of being amortized over
several financial periods, as is
allowed under French standards.
Rest of the world 1%
Asia-Pacific 5%
region 11%
UK
16%
Other
European countries
France 18%
USA/Canada 37%
12% - Germany
PlayStation®11%
Game Boy 19%
Advance®
3% GameCubeTM
42% PC
15 % PlayStation®2
Game BoyTM
Game Boy ColorTM
7%
XboxTM 1%
Distribution 5%
72%
Development
(In-house &
co-production)
Publishing 23%
KEY FIGURES