US Bank 2012 Annual Report Download - page 7
Download and view the complete annual report
Please find page 7 of the 2012 US Bank annual report below. You can navigate through the pages in the report by either clicking on the pages listed below, or by using the keyword search tool below to find specific information within the annual report.-
 1
1 -
 2
2 -
 3
3 -
 4
4 -
 5
5 -
 6
6 -
 7
7 -
 8
8 -
 9
9 -
 10
10 -
 11
11 -
 12
12 -
 13
13 -
 14
14 -
 15
15 -
 16
16 -
 17
17 -
 18
18 -
19
-
20
-
21
-
22
-
23
-
24
-
25
-
26
-
27
-
28
-
29
-
30
-
31
-
32
-
33
-
34
-
35
-
36
-
37
-
38
-
39
-
40
-
41
-
42
-
43
-
44
-
45
-
46
-
47
-
48
-
49
-
50
-
51
-
52
-
53
-
54
-
55
-
56
-
57
-
58
-
59
-
60
-
61
-
62
-
63
-
64
-
65
-
66
-
67
-
68
-
69
-
70
-
71
-
72
-
73
-
74
-
75
-
76
-
77
-
78
-
79
-
80
-
81
-
82
-
83
-
84
-
85
-
86
-
87
-
88
-
89
-
90
-
91
-
92
-
93
-
94
-
95
-
96
-
97
-
98
-
99
-
100
-
101
-
102
-
103
-
104
-
105
-
106
-
107
-
108
-
109
-
110
-
111
-
112
-
113
-
114
-
115
-
116
-
117
-
118
-
119
-
120
-
121
-
122
-
123
-
124
-
125
-
126
-
127
-
128
-
129
-
130
-
131
-
132
-
133
-
134
-
135
-
136
-
137
-
138
-
139
-
140
-
141
-
142
-
143
-
144
-
145
-
146
-
147
-
148
-
149
-
150
-
151
-
152
-
153
-
154
-
155
-
156
-
157
-
158
-
159
-
160
-
161
-
162
-
163
 |
 |

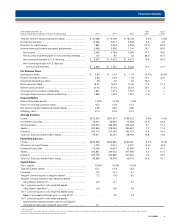
U.S. BANCORP 3
Year Ended December 31 2012 2011
(Dollars and Shares in Millions, Except Per Share Data) 2012 2011 2010 v 2011 v 2010
Total net revenue (taxable-equivalent basis) ............................... $ 20,288 $ 19,108 $ 18,148 6.2% 5.3%
Noninterest expense ................................................................... 10,456 9,911 9,383 5.5 5.6
Provision for credit losses ........................................................... 1,882 2,343 4,356 (19.7) (46.2)
Income taxes and taxable-equivalent adjustments ...................... 2,460 2,066 1,144 19.1 80.6
Net income .............................................................................. 5,490 4,788 3,265 14.7 46.6
Net (income) loss attributable to noncontrolling interests ........ 157 84 52 86.9 61.5
Net income attributable to U.S. Bancorp ................................. $ 5,647 $ 4,872 $ 3,317 15.9 46.9
Net income applicable to U.S. Bancorp
common shareholders.......................................................... $ 5,383 $ 4,721 $ 3,332 14.0 41.7
Per Common Share
Earnings per share ....................................................................... $ 2.85 $ 2.47 $ 1.74 15.4% 42.0%
Diluted earnings per share ........................................................... 2.84 2.46 1.73 15.4 42.2
Dividends declared per share ....................................................... .78 .50 .20 56.0 *
Book value per share .................................................................... 18.31 16.43 14.36 11.4 14.4
Market value per share ................................................................. 31.94 27.05 26.97 18.1 .3
Average common shares outstanding .......................................... 1,887 1,914 1,912 (1.4) .1
Average diluted common shares outstanding .............................. 1,896 1,923 1,921 (1.4) .1
Financial Ratios
Return on average assets............................................................. 1.65% 1.53% 1.16%
Return on average common equity .............................................. 16.2 15.8 12.7
Net interest margin (taxable-equivalent basis) ............................. 3.58 3.65 3.88
Efficiency ratio(a) ........................................................................... 51.5 51.8 51.5
Average Balances
Loans ............................................................................................ $215,374 $201,427 $193,022 6.9% 4.4%
Investment securities ................................................................... 72,501 63,645 47,763 13.9 33.3
Earning assets .............................................................................. 306,270 283,290 252,042 8.1 12.4
Assets ........................................................................................... 342,849 318,264 285,861 7.7 11.3
Deposits ....................................................................................... 235,710 213,159 184,721 10.6 15.4
Total U.S. Bancorp shareholders’ equity ...................................... 37,611 32,200 28,049 16.8 14.8
Period End Balances
Loans ............................................................................................ $223,329 $209,835 $197,061 6.4% 6.5%
Allowance for credit losses .......................................................... 4,733 5,014 5,531 (5.6) (9.3)
Investment securities ................................................................... 74,528 70,814 52,978 5.2 33.7
Assets ........................................................................................... 353,855 340,122 307,786 4.0 10.5
Deposits ....................................................................................... 249,183 230,885 204,252 7.9 13.0
Total U.S. Bancorp shareholders’ equity ...................................... 38,998 33,978 29,519 14.8 15.1
Capital Ratios
Tier 1 capital ................................................................................ 10.8% 10.8% 10.5%
Total risk-based capital ............................................................... 13.1 13.3 13.3
Leverage ....................................................................................... 9.2 9.1 9.1
Tangible common equity to tangible assets(b) .............................. 7.2 6.6 6.0
Tangible common equity to risk-weighted assets
using Basel I definition(b) ........................................................... 8.6 8.1 7.2
Tier 1 common equity to risk-weighted assets
using Basel I definition(b) ........................................................... 9.0 8.6 7.8
Tier 1 common equity to risk-weighted assets using
Basel III proposals published prior to June 2012(b) .................. – 8.2 7.3
Tier 1 common equity to risk-weighted assets
approximated using proposed rules for the Basel III
standardized approach released June 2012(b) ......................... 8.1 – –
* Not meaningful
(a) Computed as noninterest expense divided by the sum of net interest income on a taxable-equivalent basis and noninterest income excluding net securities gains (losses).
(b) See Non-GAAP Financial Measures beginning on page 65.
Financial Summary