US Bank 2011 Annual Report Download - page 75
Download and view the complete annual report
Please find page 75 of the 2011 US Bank annual report below. You can navigate through the pages in the report by either clicking on the pages listed below, or by using the keyword search tool below to find specific information within the annual report.-
 1
1 -
2
-
3
-
4
-
5
-
6
-
7
-
8
-
9
-
10
-
11
-
12
-
13
-
14
-
15
-
16
-
17
-
18
-
19
-
20
-
21
-
22
-
23
-
24
-
25
-
26
-
27
-
28
-
29
-
30
-
31
-
32
-
33
-
34
-
35
-
36
-
37
-
38
-
39
-
40
-
41
-
42
-
43
-
44
-
45
-
46
-
47
-
48
-
49
-
50
-
51
-
52
-
53
-
54
-
55
-
56
-
57
-
58
-
59
-
60
-
61
-
62
-
63
-
64
-
 65
65 -
 66
66 -
 67
67 -
 68
68 -
 69
69 -
 70
70 -
 71
71 -
 72
72 -
 73
73 -
 74
74 -
 75
75 -
 76
76 -
 77
77 -
 78
78 -
 79
79 -
 80
80 -
 81
81 -
 82
82 -
 83
83 -
 84
84 -
 85
85 -
86
-
87
-
88
-
89
-
90
-
91
-
92
-
93
-
94
-
95
-
96
-
97
-
98
-
99
-
100
-
101
-
102
-
103
-
104
-
105
-
106
-
107
-
108
-
109
-
110
-
111
-
112
-
113
-
114
-
115
-
116
-
117
-
118
-
119
-
120
-
121
-
122
-
123
-
124
-
125
-
126
-
127
-
128
-
129
-
130
-
131
-
132
-
133
-
134
-
135
-
136
-
137
-
138
-
139
-
140
-
141
-
142
-
143
-
144
-
145
-
146
-
147
-
148
-
149
 |
 |

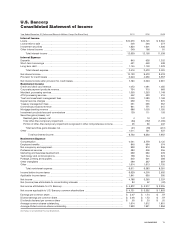
U.S. Bancorp
Consolidated Statement of Cash Flows
Year Ended December 31 (Dollars in Millions) 2011 2010 2009
Operating Activities
Net income attributable to U.S. Bancorp ............................................................. $ 4,872 $ 3,317 $ 2,205
Adjustments to reconcile net income to net cash provided by operating activities
Provision for credit losses .......................................................................... 2,343 4,356 5,557
Depreciation and amortization of premises and equipment ........................................ 266 229 220
Amortization of intangibles ......................................................................... 299 367 387
Provision for deferred income taxes ............................................................... 748 (370) (545)
Gain on sales of securities and other assets, net .................................................. (1,663) (2,023) (1,571)
Loans originated for sale in the secondary market, net of repayments............................. (45,848) (53,025) (52,720)
Proceeds from sales of loans held for sale ......................................................... 48,354 50,895 51,915
Other, net .......................................................................................... 449 1,495 2,152
Net cash provided by operating activities ....................................................... 9,820 5,241 7,600
Investing Activities
Proceeds from sales of available-for-sale investment securities ...................................... 1,018 1,212 5,784
Proceeds from maturities of held-to-maturity investment securities .................................. 1,404 167 11
Proceeds from maturities of available-for-sale investment securities ................................. 12,713 16,068 7,307
Purchases of held-to-maturity investment securities ................................................. (18,500) (1,010) (5)
Purchases of available-for-sale investment securities ................................................ (13,229) (24,025) (15,119)
Net increase in loans outstanding .................................................................... (13,418) (6,322) (106)
Proceeds from sales of loans ......................................................................... 820 1,829 2,741
Purchases of loans ................................................................................... (3,078) (4,278) (4,332)
Acquisitions, net of cash acquired .................................................................... 636 923 3,074
Other, net ............................................................................................. (1,070) (936) (74)
Net cash used in investing activities ............................................................. (32,704) (16,372) (719)
Financing Activities
Net increase in deposits .............................................................................. 24,846 20,527 7,949
Net increase (decrease) in short-term borrowings .................................................... (2,205) 592 (4,448)
Proceeds from issuance of long-term debt ........................................................... 3,611 7,044 6,040
Principal payments or redemption of long-term debt ................................................. (3,300) (8,394) (11,740)
Fees paid on exchange of income trust securities for perpetual preferred stock ..................... – (4) –
Proceeds from issuance of preferred stock ........................................................... 676 – –
Proceeds from issuance of common stock ........................................................... 180 119 2,703
Redemption of preferred stock ....................................................................... – – (6,599)
Repurchase of common stock ........................................................................ (514) – –
Repurchase of common stock warrant ............................................................... – – (139)
Cash dividends paid on preferred stock .............................................................. (118) (89) (275)
Cash dividends paid on common stock .............................................................. (817) (383) (1,025)
Net cash provided by (used in) financing activities .............................................. 22,359 19,412 (7,534)
Change in cash and due from banks ............................................................ (525) 8,281 (653)
Cash and due from banks at beginning of year ....................................................... 14,487 6,206 6,859
Cash and due from banks at end of year ............................................................. $13,962 $ 14,487 $ 6,206
Supplemental Cash Flow Disclosures
Cash paid for income taxes ........................................................................... $ 495 $ 424 $ 344
Cash paid for interest ................................................................................. 2,563 2,631 3,153
Net noncash transfers to foreclosed property ........................................................ 702 1,384 600
Acquisitions
Assets (sold) acquired.............................................................................. $ 1,761 $ (14) $ 17,212
Liabilities sold (assumed) .......................................................................... (2,100) (907) (17,870)
Net .............................................................................................. $ (339) $ (921) $ (658)
See Notes to Consolidated Financial Statements.
U.S. BANCORP 73