US Bank 2011 Annual Report Download - page 73
Download and view the complete annual report
Please find page 73 of the 2011 US Bank annual report below. You can navigate through the pages in the report by either clicking on the pages listed below, or by using the keyword search tool below to find specific information within the annual report.-
 1
1 -
2
-
3
-
4
-
5
-
6
-
7
-
8
-
9
-
10
-
11
-
12
-
13
-
14
-
15
-
16
-
17
-
18
-
19
-
20
-
21
-
22
-
23
-
24
-
25
-
26
-
27
-
28
-
29
-
30
-
31
-
32
-
33
-
34
-
35
-
36
-
37
-
38
-
39
-
40
-
41
-
42
-
43
-
44
-
45
-
46
-
47
-
48
-
49
-
50
-
51
-
52
-
53
-
54
-
55
-
56
-
57
-
58
-
59
-
60
-
61
-
62
-
 63
63 -
 64
64 -
 65
65 -
 66
66 -
 67
67 -
 68
68 -
 69
69 -
 70
70 -
 71
71 -
 72
72 -
 73
73 -
 74
74 -
 75
75 -
 76
76 -
 77
77 -
 78
78 -
 79
79 -
 80
80 -
 81
81 -
 82
82 -
 83
83 -
84
-
85
-
86
-
87
-
88
-
89
-
90
-
91
-
92
-
93
-
94
-
95
-
96
-
97
-
98
-
99
-
100
-
101
-
102
-
103
-
104
-
105
-
106
-
107
-
108
-
109
-
110
-
111
-
112
-
113
-
114
-
115
-
116
-
117
-
118
-
119
-
120
-
121
-
122
-
123
-
124
-
125
-
126
-
127
-
128
-
129
-
130
-
131
-
132
-
133
-
134
-
135
-
136
-
137
-
138
-
139
-
140
-
141
-
142
-
143
-
144
-
145
-
146
-
147
-
148
-
149
 |
 |

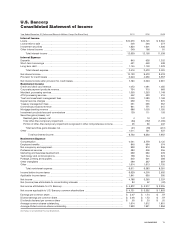
U.S. Bancorp
Consolidated Statement of Income
Year Ended December 31 (Dollars and Shares in Millions, Except Per Share Data) 2011 2010 2009
Interest Income
Loans ................................................................................................... $10,370 $10,145 $ 9,564
Loans held for sale ..................................................................................... 200 246 277
Investment securities ................................................................................... 1,820 1,601 1,606
Other interest income .................................................................................. 249 166 91
Total interest income .............................................................................. 12,639 12,158 11,538
Interest Expense
Deposits ................................................................................................ 840 928 1,202
Short-term borrowings ................................................................................. 531 548 539
Long-term debt ......................................................................................... 1,145 1,103 1,279
Total interest expense ............................................................................. 2,516 2,579 3,020
Net interest income ..................................................................................... 10,123 9,579 8,518
Provision for credit losses .............................................................................. 2,343 4,356 5,557
Net interest income after provision for credit losses .................................................... 7,780 5,223 2,961
Noninterest Income
Credit and debit card revenue .......................................................................... 1,073 1,091 1,055
Corporate payment products revenue .................................................................. 734 710 669
Merchant processing services .......................................................................... 1,355 1,253 1,148
ATM processing services ............................................................................... 452 423 410
Trust and investment management fees ................................................................ 1,000 1,080 1,168
Deposit service charges ................................................................................ 659 710 970
Treasury management fees ............................................................................. 551 555 552
Commercial products revenue ......................................................................... 841 771 615
Mortgage banking revenue ............................................................................. 986 1,003 1,035
Investment products fees and commissions ........................................................... 129 111 109
Securities gains (losses), net
Realized gains (losses), net .......................................................................... 4 13 147
Total other-than-temporary impairment .............................................................. (60) (157) (1,000)
Portion of other-than-temporary impairment recognized in other comprehensive income ........... 25 66 402
Total securities gains (losses), net ................................................................. (31) (78) (451)
Other ................................................................................................... 1,011 731 672
Total noninterest income ....................................................................... 8,760 8,360 7,952
Noninterest Expense
Compensation .......................................................................................... 4,041 3,779 3,135
Employee benefits ...................................................................................... 845 694 574
Net occupancy and equipment ......................................................................... 999 919 836
Professional services ................................................................................... 383 306 255
Marketing and business development .................................................................. 369 360 378
Technology and communications ...................................................................... 758 744 673
Postage, printing and supplies ......................................................................... 303 301 288
Other intangibles ....................................................................................... 299 367 387
Other ................................................................................................... 1,914 1,913 1,755
Total noninterest expense ......................................................................... 9,911 9,383 8,281
Income before income taxes ........................................................................... 6,629 4,200 2,632
Applicable income taxes ............................................................................... 1,841 935 395
Net income ............................................................................................. 4,788 3,265 2,237
Net (income) loss attributable to noncontrolling interests .............................................. 84 52 (32)
Net income attributable to U.S. Bancorp ............................................................... $ 4,872 $ 3,317 $ 2,205
Net income applicable to U.S. Bancorp common shareholders ........................................ $ 4,721 $ 3,332 $ 1,803
Earnings per common share ............................................................................ $ 2.47 $ 1.74 $ .97
Diluted earnings per common share .................................................................... $ 2.46 $ 1.73 $ .97
Dividends declared per common share ................................................................ $ .50 $ .20 $ .20
Average common shares outstanding .................................................................. 1,914 1,912 1,851
Average diluted common shares outstanding .......................................................... 1,923 1,921 1,859
See Notes to Consolidated Financial Statements.
U.S. BANCORP 71