US Bank 2011 Annual Report Download - page 4
Download and view the complete annual report
Please find page 4 of the 2011 US Bank annual report below. You can navigate through the pages in the report by either clicking on the pages listed below, or by using the keyword search tool below to find specific information within the annual report.-
 1
1 -
 2
2 -
 3
3 -
 4
4 -
 5
5 -
 6
6 -
 7
7 -
 8
8 -
 9
9 -
 10
10 -
 11
11 -
 12
12 -
 13
13 -
 14
14 -
 15
15 -
16
-
17
-
18
-
19
-
20
-
21
-
22
-
23
-
24
-
25
-
26
-
27
-
28
-
29
-
30
-
31
-
32
-
33
-
34
-
35
-
36
-
37
-
38
-
39
-
40
-
41
-
42
-
43
-
44
-
45
-
46
-
47
-
48
-
49
-
50
-
51
-
52
-
53
-
54
-
55
-
56
-
57
-
58
-
59
-
60
-
61
-
62
-
63
-
64
-
65
-
66
-
67
-
68
-
69
-
70
-
71
-
72
-
73
-
74
-
75
-
76
-
77
-
78
-
79
-
80
-
81
-
82
-
83
-
84
-
85
-
86
-
87
-
88
-
89
-
90
-
91
-
92
-
93
-
94
-
95
-
96
-
97
-
98
-
99
-
100
-
101
-
102
-
103
-
104
-
105
-
106
-
107
-
108
-
109
-
110
-
111
-
112
-
113
-
114
-
115
-
116
-
117
-
118
-
119
-
120
-
121
-
122
-
123
-
124
-
125
-
126
-
127
-
128
-
129
-
130
-
131
-
132
-
133
-
134
-
135
-
136
-
137
-
138
-
139
-
140
-
141
-
142
-
143
-
144
-
145
-
146
-
147
-
148
-
149
 |
 |

2 U.S. BANCORP
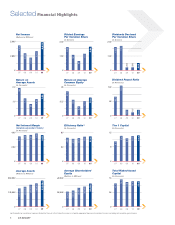
Net Income
(Dollars in Millions)
5,000
2
,500
0
07 08 09 10 11
4,324
2,946
2,205
4,872
3,317
Return on
Average Assets
(In Percents)
2
.0
1.0
0
07 08 09 10 11
1.93
1.21
.82
1.53
1.16
Net Interest Margin
(taxable-equivalent basis)
(In Percents)
4.00
2
.00
0
07 08 09 10 11
3.47
3.66
3.67
3.65
3.88
Average Assets
(Dollars in Millions)
350,000
175,000
0
07 08 09 10 11
223,621
244,400
268,360
318,264
285,861
Diluted Earnings
Per Common Share
(In Dollars)
3.00
1.50
0
07 08 09 10 11
2.42
1.61
.97
2.46
1.73
Return on Average
Common Equity
(In Percents)
25
12.5
0
07 08 09 10 11
21.3
13.9
8.2
15.8
12.7
Efficiency Ratio(a)
(In Percents)
60
30
0
07 08 09 10 11
49.2
46.9
48.4
51.8
51.5
Average Shareholders’
Equity
(Dollars in Millions)
40,000
2
0,000
0
07 08 09 10 11
20,997
22,570
26,307
32,200
28,049
Dividends Declared
Per Common Share
(In Dollars)
2
.00
1.00
0
07 08 09 10 11
1.625
1.700
.200
.200
.500
Dividend Payout Ratio
(In Percents)
100
50
0
07 08 09 10 11
66.3
104.9
20.6
20.2
11.5
Tier 1 Capital
(In Percents)
12
6
0
07 08 09 10 11
8.3
10.6
9.6
10.8
10.5
Total Risked-based
Capital
(In Percents)
15
7.5
0
07 08 09 10 11
12.2
14.3
13.3
12.9
13.3
Selected Financial Highlights
(a) Computed as noninterest expense divided by the sum of net interest income on a taxable-equivalent basis and noninterest income excluding net securities gains (losses).