US Bank 2004 Annual Report Download - page 5
Download and view the complete annual report
Please find page 5 of the 2004 US Bank annual report below. You can navigate through the pages in the report by either clicking on the pages listed below, or by using the keyword search tool below to find specific information within the annual report.-
 1
1 -
 2
2 -
 3
3 -
 4
4 -
 5
5 -
 6
6 -
 7
7 -
 8
8 -
 9
9 -
 10
10 -
 11
11 -
 12
12 -
 13
13 -
 14
14 -
 15
15 -
 16
16 -
17
-
18
-
19
-
20
-
21
-
22
-
23
-
24
-
25
-
26
-
27
-
28
-
29
-
30
-
31
-
32
-
33
-
34
-
35
-
36
-
37
-
38
-
39
-
40
-
41
-
42
-
43
-
44
-
45
-
46
-
47
-
48
-
49
-
50
-
51
-
52
-
53
-
54
-
55
-
56
-
57
-
58
-
59
-
60
-
61
-
62
-
63
-
64
-
65
-
66
-
67
-
68
-
69
-
70
-
71
-
72
-
73
-
74
-
75
-
76
-
77
-
78
-
79
-
80
-
81
-
82
-
83
-
84
-
85
-
86
-
87
-
88
-
89
-
90
-
91
-
92
-
93
-
94
-
95
-
96
-
97
-
98
-
99
-
100
-
101
-
102
-
103
-
104
-
105
-
106
-
107
-
108
-
109
-
110
-
111
-
112
-
113
-
114
-
115
-
116
-
117
-
118
-
119
-
120
-
121
-
122
-
123
-
124
-
125
-
126
-
127
-
128
-
129
 |
 |

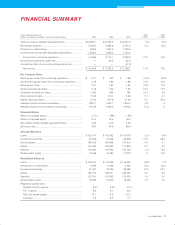
Year Ended December 31 2004 2003
(Dollars and Shares in Millions, Except Per Share Data) 2004 2003 2002 v 2003 v 2002
Total net revenue (taxable-equivalent basis) .......................... $12,659.1 $12,530.5 $12,057.9 1.0% 3.9%
Noninterest expense .............................................................. 5,784.5 5,596.9 5,740.5 3.4 (2.5)
Provision for credit losses ...................................................... 669.6 1,254.0 1,349.0
Income taxes and taxable-equivalent adjustments ................. 2,038.2 1,969.5 1,740.4
Income from continuing operations .................................... 4,166.8 3,710.1 3,228.0 12.3 14.9
Discontinued operations (after-tax) ......................................... — 22.5 (22.7)
Cumulative effect of accounting change (after-tax) ................ — — (37.2)
Net income .......................................................................... $ 4,166.8 $ 3,732.6 $ 3,168.1 11.6 17.8
Per Common Share
Earnings per share from continuing operations ...................... $ 2.21 $ 1.93 $ 1.68 14.5% 14.9%
Diluted earnings per share from continuing operations .......... 2.18 1.92 1.68 13.5 14.3
Earnings per share .................................................................. 2.21 1.94 1.65 13.9 17.6
Diluted earnings per share ...................................................... 2.18 1.93 1.65 13.0 17.0
Dividends declared per share .................................................. 1.020 .855 .780 19.3 9.6
Book value per share ............................................................... 10.52 10.01 9.62 5.1 4.1
Market value per share ............................................................ 31.32 29.78 21.22 5.2 40.3
Average common shares outstanding ..................................... 1,887.1 1,923.7 1,916.0 (1.9) .4
Average diluted common shares outstanding ......................... 1,912.9 1,936.2 1,924.8 (1.2) .6
Financial Ratios
Return on average assets ....................................................... 2.17% 1.99% 1.84%
Return on average equity ........................................................ 21.4 19.2 18.3
Net interest margin (taxable-equivalent basis) ........................ 4.25 4.49 4.65
Effi ciency ratio ......................................................................... 45.3 45.6 48.8
Average Balances
Loans ....................................................................................... $ 122,141 $ 118,362 $ 114,453 3.2% 3.4%
Investment securities .............................................................. 43,009 37,248 28,829 15.5 29.2
Earning assets ......................................................................... 168,123 160,808 147,410 4.5 9.1
Assets ...................................................................................... 191,593 187,630 171,948 2.1 9.1
Deposits .................................................................................. 116,222 116,553 105,124 (.3) 10.9
Shareholders’ equity ............................................................... 19,459 19,393 17,273 .3 12.3
Period End Balances
Loans ....................................................................................... $ 126,315 $ 118,235 $ 116,251 6.8% 1.7%
Allowance for credit losses ..................................................... 2,269 2,369 2,422 (4.2) (2.2)
Investment securities .............................................................. 41,481 43,334 28,488 (4.3) 52.1
Assets ...................................................................................... 195,104 189,471 180,027 3.0 5.2
Deposits .................................................................................. 120,741 119,052 115,534 1.4 3.0
Shareholders’ equity ............................................................... 19,539 19,242 18,436 1.5 4.4
Regulatory capital ratios
Tangible common equity .................................................... 6.4% 6.5% 5.7%
Tier 1 capital ....................................................................... 8.6 9.1 8.0
Total risk-based capital ...................................................... 13.1 13.6 12.4
Leverage .............................................................................. 7.9 8.0 7.7
FINANCIAL SUMMARY
U.S. BANCORP 3