US Bank 2002 Annual Report Download - page 4
Download and view the complete annual report
Please find page 4 of the 2002 US Bank annual report below. You can navigate through the pages in the report by either clicking on the pages listed below, or by using the keyword search tool below to find specific information within the annual report.-
 1
1 -
 2
2 -
 3
3 -
 4
4 -
 5
5 -
 6
6 -
 7
7 -
 8
8 -
 9
9 -
 10
10 -
 11
11 -
 12
12 -
 13
13 -
 14
14 -
 15
15 -
16
-
17
-
18
-
19
-
20
-
21
-
22
-
23
-
24
-
25
-
26
-
27
-
28
-
29
-
30
-
31
-
32
-
33
-
34
-
35
-
36
-
37
-
38
-
39
-
40
-
41
-
42
-
43
-
44
-
45
-
46
-
47
-
48
-
49
-
50
-
51
-
52
-
53
-
54
-
55
-
56
-
57
-
58
-
59
-
60
-
61
-
62
-
63
-
64
-
65
-
66
-
67
-
68
-
69
-
70
-
71
-
72
-
73
-
74
-
75
-
76
-
77
-
78
-
79
-
80
-
81
-
82
-
83
-
84
-
85
-
86
-
87
-
88
-
89
-
90
-
91
-
92
-
93
-
94
-
95
-
96
-
97
-
98
-
99
-
100
-
101
-
102
-
103
-
104
-
105
-
106
-
107
-
108
-
109
-
110
-
111
-
112
-
113
-
114
-
115
-
116
-
117
-
118
-
119
-
120
-
121
-
122
-
123
-
124
 |
 |

2 U.S. Bancorp
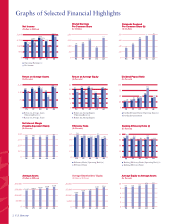
Graphs of Selected Financial Highlights
Net Income
(Dollars in Millions)
Net Income
(Dollars in Millions)
Operating Earnings(a)
Net Income
3,600
2,700
1,800
900
09898
2,519.3
2,132.9
9999
2,799.0
2,381.8
0000
3,106.9
2,875.6
0101
2,550.8
1,706.5
0202
3,537.7
3,289.2
Diluted Earnings
Per Common Share
(In Dollars)
Diluted Earnings
Per Common Share
(In Dollars)
2.00
1.50
1.00
.50
09898
1.10
9999
1.23
0000
1.50
0101
.88
0202
1.71
Dividends Declared
Per Common Share (b)
(In Dollars)
Dividends Declared
Per Common Share (b)
(In Dollars)
.80
.60
.40
.20
09898
.33
9999
.46
0000
.65
0101
.75
0202
.78
Return on Average Assets
(In Percents)
Return on Average Assets
(In Percents)
Return on Average Assets
(Operating Basis)(a)
Return on Average Assets
2.25
1.50
.75
09898
1.76
1.49
9999
1.86
1.59
0000
1.96
1.81
0101
1.54
1.03
0202
2.06 1.91
Return on Average Equity
(In Percents)
Return on Average Equity
(In Percents)
Return on Average Equity
(Operating Basis)(a)
Return on Average Equity
25
20
15
10
5
09898
20.3
17.2
9999
21.2
18.0
0000
21.6 20.0
0101
15.7
10.5
0202
20.9 19.4
Dividend Payout Ratio
(In Percents)
Dividend Payout Ratio
(In Percents)
Dividend Payout Ratio (Operating Basis)(a)
Dividend Payout Ratio
100
75
50
25
09898 9999
31.7 37.3
0000
40.1 43.4
0101
57.0
85.2
0202
42.5 45.7
25.3 29.9
Net Interest Margin
(Taxable-Equivalent Basis)
(In Percents)
Net Interest Margin
(Taxable-Equivalent Basis)
(In Percents)
5.00
3.75
2.50
1.25
09898
4.43
9999
4.40
0000
4.33
0101
4.42
0202
4.61
Efficiency Ratio
(In Percents)
Efficiency Ratio
(In Percents)
Efficiency Ratio (Operating Basis)(a)
Efficiency Ratio
60
45
30
15
09898 9999
50.5
55.7
0000
48.8 51.9
0101
49.5
57.5
0202
47.750.3
58.3
52.2
Banking Efficiency Ratio (c)
(In Percents)
Banking Efficiency Ratio (c)
(In Percents)
Banking Efficiency Ratio (Operating Basis)(a)
Banking Efficiency Ratio
60
45
30
15
09898 9999
46.3
52.1
0000
43.5 46.8
0101
45.2
52.5
0202
44.0 46.8
49.7
56.1
Average Assets
(Dollars in Millions)
Average Assets
(Dollars in Millions)
200,000
150,000
100,000
50,000
09898
142,887
9999
150,167
0000
158,481
0101
165,944
0202
171,948
Average Shareholders’ Equity
(Dollars in Millions)
20,000
15,000
10,000
5,000
09898
12,383
9999
13,221
0000
14,365
0101
16,201
0202
16,963
Average Equity to Average Assets
(In Percents)
Average Equity to Average Assets
(In Percents)
10
8
6
4
2
09898
8.67
9999
8.80
0000
9.06
0101
9.76
0202
9.87