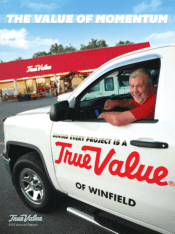
True Value 2015 Annual Report Download - page 4
Download and view the complete annual report
Please find page 4 of the 2015 True Value annual report below. You can navigate through the pages in the report by either clicking on the pages listed below, or by using the keyword search tool below to find specific information within the annual report.-
 1
1 -
 2
2 -
 3
3 -
 4
4 -
 5
5 -
 6
6 -
 7
7 -
 8
8 -
 9
9 -
 10
10 -
 11
11 -
 12
12 -
 13
13 -
 14
14 -
 15
15 -
16
-
17
 |
 |

4 TRUE VALUE 2015 ANNUAL REPORT
NET MARGIN
INVESTMENTS
THREE-YEAR PERIOD OF SIGNIFICANT
INVESTMENT TO ACCELERATE PERFORMANCE
2013 2014 2015 2016 2017 2018 2019 2020 2021 2022
3-YEAR INITIAL
SIGNIFICANT
INVESTMENT
PROJECTED
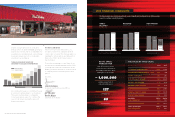
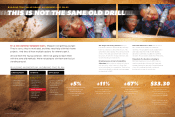
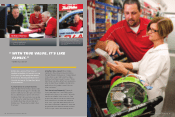
Despite a tough spring season, total gross
billings came in at $2,033,196,000, growing by
2.0 percent over last year on a comparable 52-
week basis. As we had planned, our net margin
was down, largely due to the considerable
investments we’re making.
We continued to keep our commitment to pay
a consistent cash dividend to our members.
This year’s cash dividend is comparable
to last year, and we expect to continue this
level of cash returns during this period of
heavy reinvestment.
The best is still ahead
When we first presented this plan to you,
we said it would not be a large binder that
collects dust on a shelf. This strategic plan is a
roadmap for action, and we are taking action.
Bold action. That’s what it takes to drive
transformation.
The results are starting to come. Many of our
investments are already gaining traction. With
your help and continued commitment, we are
building on that momentum to create the kind
of company that we will all be proud to be a
part of.
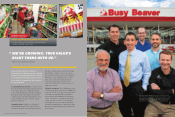
Sincerely,
John R. Hartmann
President and Chief Executive Ocer
Brent A. Burger
Chairman of the Board
TRUE VALUE 2015 ANNUAL REPORT 5
We have begun to generate momentum in a year of significant investment in our future, and we
expect to continue to build from here.
THE VALUE OF TRUE VALUE
($ IN MILLIONS) 2014 2015
PATRONAGE DIVIDEND/CASH $20.5 $19.0
PATRONAGE DIVIDEND/NOTES & STOCK $20.6 0.0
INTEREST ON NOTES $6.2
$6.1
PROMOTIONAL DISCOUNTS $35.1 $36.0
DATING & ANTICIPATION $17.1
$17. 9
REUNION SPIFFS/RACKING $7. 5
$7. 8
MARKETING REIMBURSEMENTS $10.9
$10.3
GROWTH CREDITS & LOANS $33.7
$41.0
PROMOTIONAL FREIGHT $3.6
$5.8
SU BTOTAL $155.2 $143.9
% OF PURCHASES 8.2% 7.5%
STRATEGIC INVESTMENT $13.2 $23.2
TOTAL INVESTMENT $168.4 $167.1
% OF PURCHASES 8.9% 8.8%
GROSS
BILLINGS*
$ IN MILLIONS
$1,900.0
2013
$2,014.8
2014 2015
$2,033.2
$1,411.5
2013
$1,495.0
2014 2015
$1 ,497.2
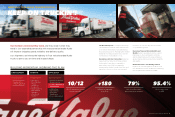
2015 FINANCIAL HIGHLIGHTS
With DTV, new stores and
conversions, we’re doing more
than adding retail space. We’re
making the co-op stronger.
RETAIL SPACE:
MORE/BETTER
Added square feet of
relevant retail space
~ 1,000,000
* Note: fiscal 2014 figures are based on a 53 week year,
fiscal 2013 and 2015 figures are based on 52 week years
New Stores
127
Conversions
63
†Including 2014 Strategy Cost
‡Including 2015 Strategy Cost
$41.1†
$19.0‡
$13.2
million
cost
$23.2
million
cost
REVENUE*
$ IN MILLIONS
NET MARGIN
$ IN MILLIONS
2015
2013 2014
$55.3