Tiscali 2013 Annual Report Download - page 19
Download and view the complete annual report
Please find page 19 of the 2013 Tiscali annual report below. You can navigate through the pages in the report by either clicking on the pages listed below, or by using the keyword search tool below to find specific information within the annual report.-
 1
1 -
2
-
3
-
4
-
5
-
6
-
7
-
8
-
 9
9 -
 10
10 -
 11
11 -
 12
12 -
 13
13 -
 14
14 -
 15
15 -
 16
16 -
 17
17 -
 18
18 -
 19
19 -
 20
20 -
 21
21 -
 22
22 -
 23
23 -
 24
24 -
 25
25 -
 26
26 -
 27
27 -
 28
28 -
 29
29 -
30
-
31
-
32
-
33
-
34
-
35
-
36
-
37
-
38
-
39
-
40
-
41
-
42
-
43
-
44
-
45
-
46
-
47
-
48
-
49
-
50
-
51
-
52
-
53
-
54
-
55
-
56
-
57
-
58
-
59
-
60
-
61
-
62
-
63
-
64
-
65
-
66
-
67
-
68
-
69
-
70
-
71
-
72
-
73
-
74
-
75
-
76
-
77
-
78
-
79
-
80
-
81
-
82
-
83
-
84
-
85
-
86
-
87
-
88
-
89
-
90
-
91
-
92
-
93
-
94
-
95
-
96
-
97
-
98
-
99
-
100
-
101
-
102
-
103
-
104
-
105
-
106
-
107
-
108
-
109
-
110
-
111
-
112
-
113
-
114
-
115
-
116
-
117
-
118
-
119
-
120
-
121
-
122
-
123
-
124
-
125
-
126
-
127
-
128
-
129
-
130
-
131
-
132
-
133
-
134
-
135
-
136
-
137
-
138
-
139
-
140
-
141
-
142
-
143
-
144
-
145
-
146
-
147
-
148
-
149
-
150
-
151
-
152
-
153
-
154
-
155
-
156
-
157
-
158
-
159
-
160
-
161
-
162
-
163
-
164
-
165
-
166
-
167
-
168
-
169
-
170
-
171
-
172
-
173
-
174
-
175
-
176
-
177
-
178
-
179
-
180
-
181
-
182
-
183
-
184
-
185
-
186
-
187
-
188
-
189
-
190
-
191
-
192
-
193
-
194
 |
 |

Annual financial report as at 31 December 2013
Date
File Name
Status
Page
-
Annual Report as at 31
December 2013
19
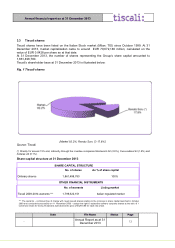
Revenues by business segment
Fig. 3 - Breakdown of revenues by business line and access mode
Source: Tiscali
Access
The segment in question, which includes revenues from Internet access services via broadband
(ADSL) and narrowband (dial-up), the flat component of the bundled ranges (access fees) and mobile
telephone revenues, in 2013 generated revenues of around EUR 161.9 million, down by 7.3% with
respect to the figure in the same period in 2012 (EUR 174.7 million).
The decrease in revenues is mainly attributable to the ADSL access services (EUR 93 million as at 31
December 2013 compared with EUR 101.3 million as at 31 December 2012) and the VOIP segment
(EUR 66.4 million as at 31 December 2013 compared with EUR 69.7 million at 31 December 2012).
As at 31 December 2013, ADSL customers came to around 498.2 thousand of which 357.9 thousand
under direct LLU (Local Loop Unbundling). Direct ADSL customers increased by around 19 thousand
with respect 31 December 2012.
The customers who use a dial-up access (narrowband) and analogical voice service stood at around
43.3 thousand users (of which around 26.1 thousand in WLR mode), up by around 4.3 thousand with
respect to the previous year.