Tiscali 2013 Annual Report Download - page 18
Download and view the complete annual report
Please find page 18 of the 2013 Tiscali annual report below. You can navigate through the pages in the report by either clicking on the pages listed below, or by using the keyword search tool below to find specific information within the annual report.-
 1
1 -
2
-
3
-
4
-
5
-
6
-
7
-
 8
8 -
 9
9 -
 10
10 -
 11
11 -
 12
12 -
 13
13 -
 14
14 -
 15
15 -
 16
16 -
 17
17 -
 18
18 -
 19
19 -
 20
20 -
 21
21 -
 22
22 -
 23
23 -
 24
24 -
 25
25 -
 26
26 -
 27
27 -
 28
28 -
29
-
30
-
31
-
32
-
33
-
34
-
35
-
36
-
37
-
38
-
39
-
40
-
41
-
42
-
43
-
44
-
45
-
46
-
47
-
48
-
49
-
50
-
51
-
52
-
53
-
54
-
55
-
56
-
57
-
58
-
59
-
60
-
61
-
62
-
63
-
64
-
65
-
66
-
67
-
68
-
69
-
70
-
71
-
72
-
73
-
74
-
75
-
76
-
77
-
78
-
79
-
80
-
81
-
82
-
83
-
84
-
85
-
86
-
87
-
88
-
89
-
90
-
91
-
92
-
93
-
94
-
95
-
96
-
97
-
98
-
99
-
100
-
101
-
102
-
103
-
104
-
105
-
106
-
107
-
108
-
109
-
110
-
111
-
112
-
113
-
114
-
115
-
116
-
117
-
118
-
119
-
120
-
121
-
122
-
123
-
124
-
125
-
126
-
127
-
128
-
129
-
130
-
131
-
132
-
133
-
134
-
135
-
136
-
137
-
138
-
139
-
140
-
141
-
142
-
143
-
144
-
145
-
146
-
147
-
148
-
149
-
150
-
151
-
152
-
153
-
154
-
155
-
156
-
157
-
158
-
159
-
160
-
161
-
162
-
163
-
164
-
165
-
166
-
167
-
168
-
169
-
170
-
171
-
172
-
173
-
174
-
175
-
176
-
177
-
178
-
179
-
180
-
181
-
182
-
183
-
184
-
185
-
186
-
187
-
188
-
189
-
190
-
191
-
192
-
193
-
194
 |
 |

Annual financial report as at 31 December 2013
Date
File Name
Status
Page
-
Annual Report as at 31
December 2013
18
Operational income statement - Group
(EUR mln)
2013
2012 Restated*
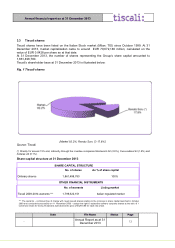
Revenues
223.4
233.8
Access revenues (including VoIP)
161.9
174.7
of which: ADSL
93.0
101.3
of which VOIP
66.4
69.7
of which MVNO
2.6
3.7
Dial Up revenues (narrowband)
2.0
3.1
Voice revenues
15.9
14.6
Business service revenues
18.1
16.4
Media and value added service revenues
23.8
23.4
Other revenues
1.7
1.5
Gross operating margin
117.2
123.9
Indirect operating costs
57.0
57.8
Marketing and sales
8.9
8.2
Payroll and related costs
34.6
34.4
Other indirect costs
13.4
15.2
Other (income) / expense
(6.8)
(4.5)
Adjusted Gross Operating Result (EBITDA)
67.1
70.6
Write-down of receivables
14.6
26.3
Gross Operating Result (EBITDA)
52.4
44.3
Amortisation/depreciation
39.8
42.8
Gross result (EBIT) before restructuring costs and
provisions for risks
12.6
1.5
Operating result (EBIT)
9.3
(0.1)
Group Net Result
(4.8)
(15.8)
(*) The figures as at 31 December 2012 have been recalculated so as to assimilate the effect of the application,
as from 1 January 2013 (retrospectively), of the new revised IAS 19 accounting standard (employee benefits); for
further details please see the section “Form and content of the accounting statements”.